News
Email Reports, Fathom Analytics Importer, and More
20. February 2026
This small update includes a number of improvements.
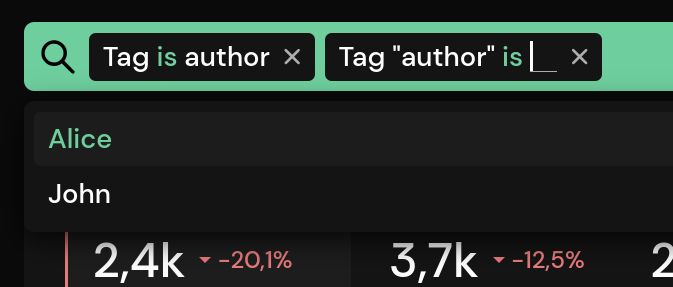
Filtering Tags
When filtering by tag, the tag value filter field will now be added automatically.
Fathom Analytics Import
The Fathom Analytics Importer has been updated to support the latest version of Fathom. Please refer to our documentation for more information.
Improved Email Reports
Three new options have been added to email reports: 'Reply to', 'Hide optional links' and 'Set a start date'.
By configuring a reply-to email address, you can receive replies directly from your clients when they receive a report in their inbox. You can use the start date to configure the date on which the first email report is sent. For example, you can set it to send reports on the same day each week.
Some of the links in the bottom section are optional, like our social media. This includes the greeting, meaning you can remove any reference to Pirsch, except for links that are legally required.
You can find the full changelog in our documentation.
Email Reports and Other Improvements
31. January 2026
In this update, we improved the email reports and the dashboard.
Updated Panels
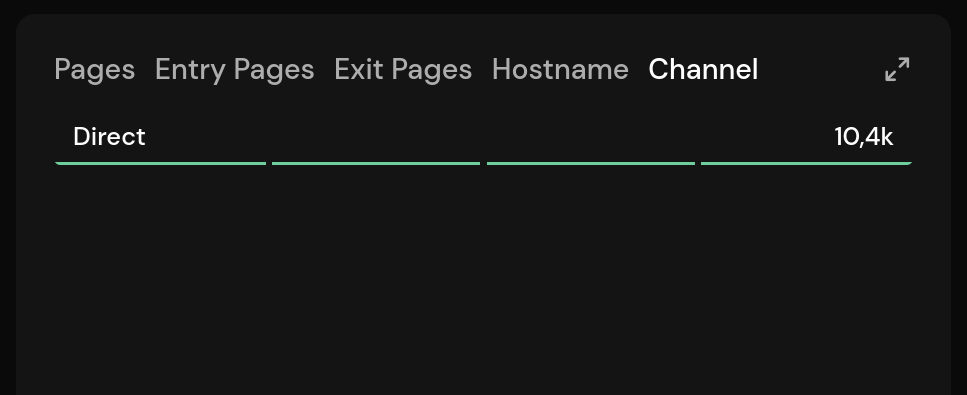
A significant change to the user interface is that the UTM parameters and channels have been moved. The panels they were in before got quite full and were easy to overlook. That's why channels have been moved to the referrers panel and UTM parameters have been moved to a dedicated panel.
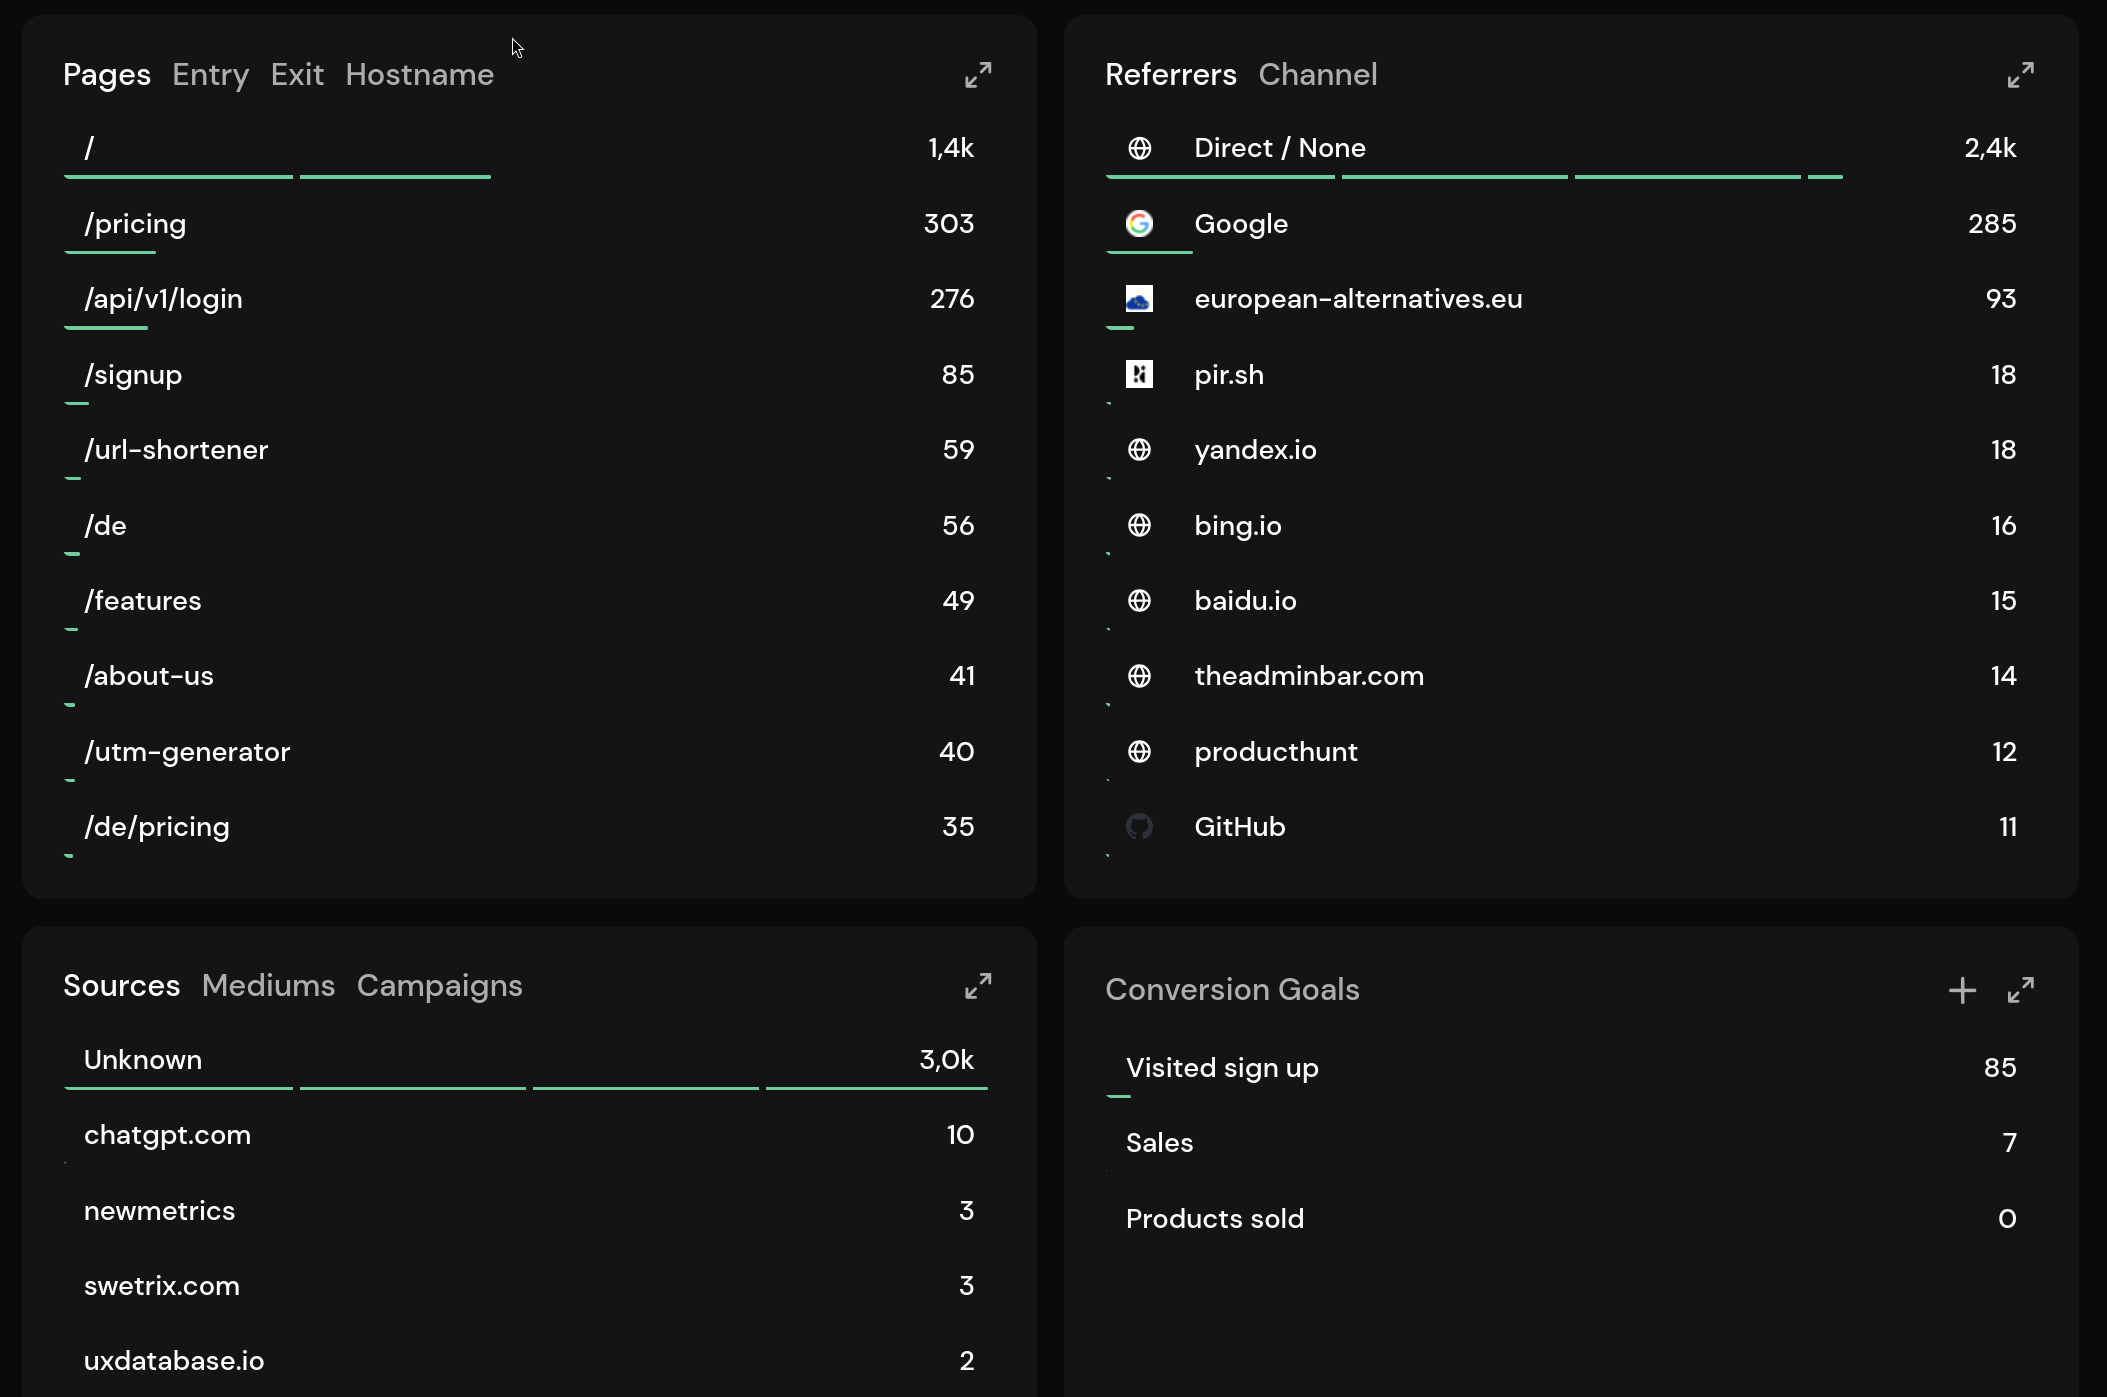
As before, UTM content and term parameters will only appear if you filter by source, campaign or medium.
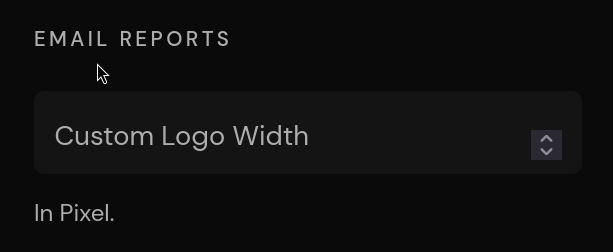
Improved Email Reports
You can now take logo customisation for email reports a bit further by specifying a width in the theme settings. This option enables you to add a wider logo.
If configured, the dashboard name will also be displayed in the email subject instead of just the domain.
Improved Search
If you collect the title for page views (configured in the general settings), you can now filter for them.
Other Improvements
As always, we have improved bot filtering, which is becoming increasingly important as AI crawlers spam websites. We also enhanced referrer extraction and resolved an issue with displaying titles in the pages panel.
You can find the full changelog in our documentation.
End of 2025
20. December 2025
It's the end of 2025, so it's time for us to take a break. We'll be back in 2026!
Our team wishes you a happy holiday season and a prosperous New Year. Thank you for staying with us or joining us over the past few months :)
Bot Filter Improvements and 365d on the Overview
17. November 2025
As you may have noticed, there has recently been an increase in bot and spam traffic from various sources, due to AI scraping and similar activities. With this update, we are rolling out IP range blocking for known crawler networks. This should greatly reduce the noise and help to keep the data as accurate as possible.
If you notice any unusual traffic, please reach out to our support team immediately.
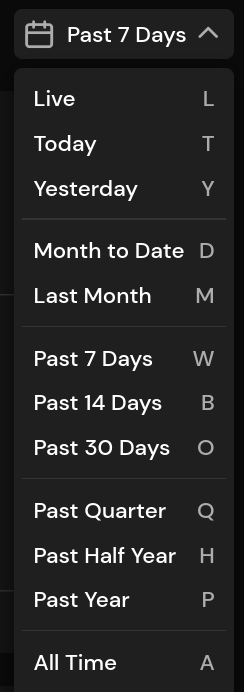
This update also includes a minor enhancement to the overview: you can now filter by the last 365 days.
You can find the full changelog in our documentation.
GSC Keyword Filtering, Colorblind Mode, and Bug Fixes
09. October 2025
This major update includes a variety of new features and bug fixes. Let's dive right in!
Google Search Console Filtering
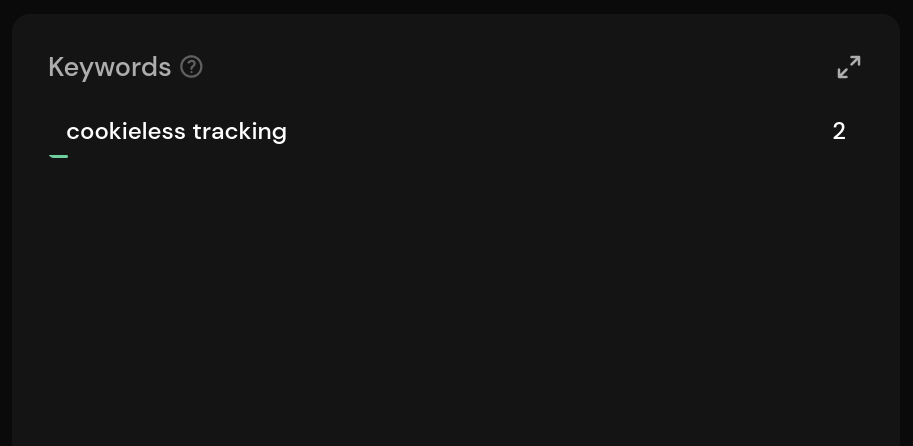
You can now filter the dashboard by clicking on a keyword in the Google Search Console panel. Using this integration will display the top 10 pages viewed if you click a keyword in the list.
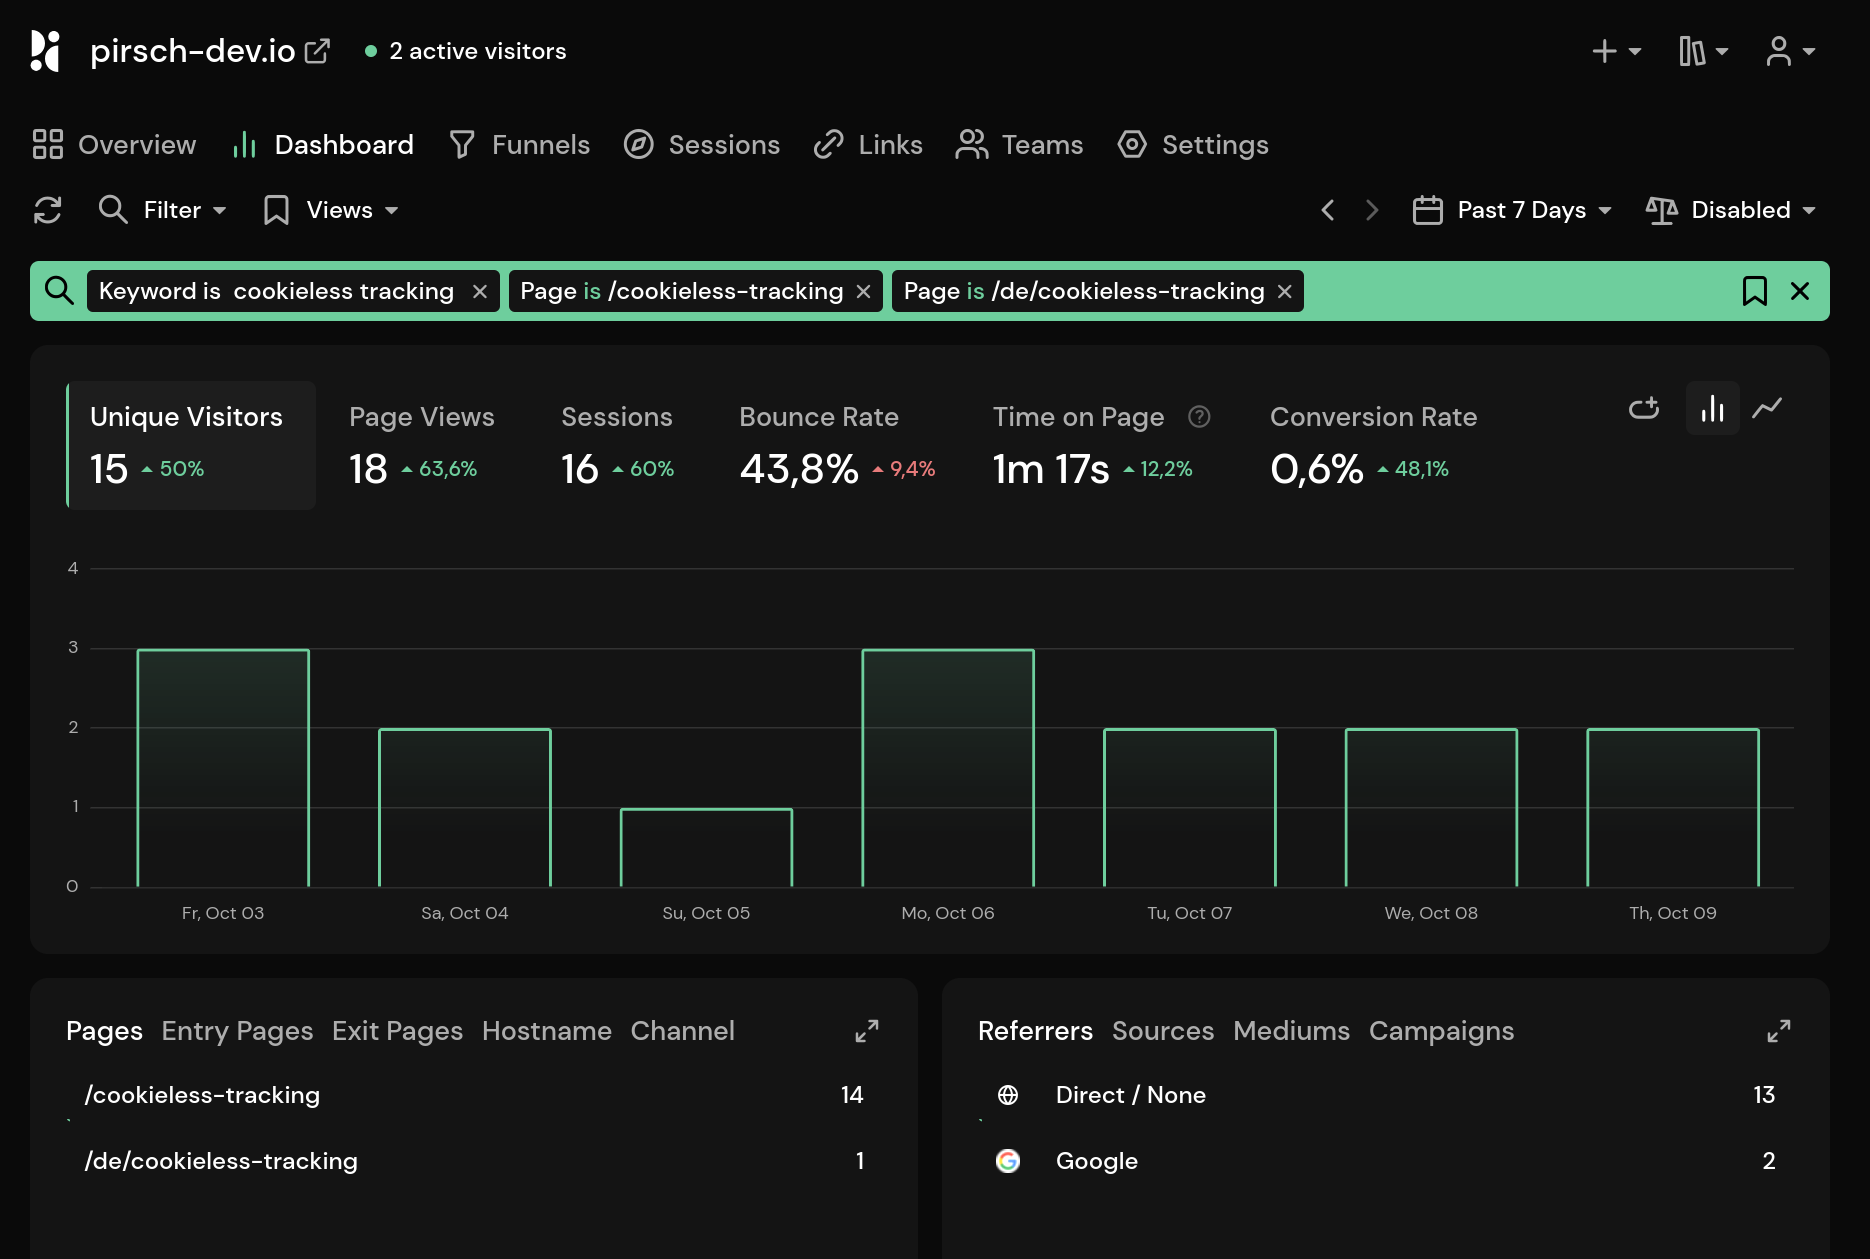
However, there are a few limitations. Since we do not know which sessions belong to which keywords, clicking on a keyword will filter the dashboard by path rather than by the keyword itself. The dashboard is limited to the top 10 pages because having hundreds of pages for a single keyword would be overwhelming and break the integration.
The keyword filter will also apply to the GSC panel.
Colorblind Mode
It is now possible to activate color-blind mode. This overrides theme settings, ensuring the dashboard has higher contrast and colors that can easily be distinguished by everyone.
This new setting can be found on the Account Settings page via the dropdown menu in the top right-hand corner.
Hide the Dashboard Button in Email Reports
Email reports contain a button that links to the dashboard, which offers various options (public dashboard, private access link, etc.). You can now also completely disable this feature.
Transfering the Dashboard Ownership
This has always been possible, but we have made a slight change so that a dashboard can now be transferred to a different account even if it doesn't have an active subscription. Please note that we do not collect new data for non-subscribed accounts.
Lots of Bug Fixes
We've fixed a number of bugs that affected usability. These include:
- Missing translations
- The description of the Google Analytics import settings
- Validating the graph annotation date and time for various time zones
- The 'period up' button starting at 23:00
- Selecting 00:00 when viewing a single day by the hour
You can find the full changelog in our documentation.
WordPress Plugin Version 2.0!
12. September 2025
We're thrilled to announce the release of the Pirsch Analytics WordPress Plugin v2.0! This major release brings powerful new features, significant improvements, and important fixes that make website analytics on WordPress using Pirsch easier and more flexible.
Embedded Dashboard
Access your Pirsch Analytics dashboard directly within your WordPress admin panel. No more switching between tabs – monitor your website's performance without leaving WordPress.
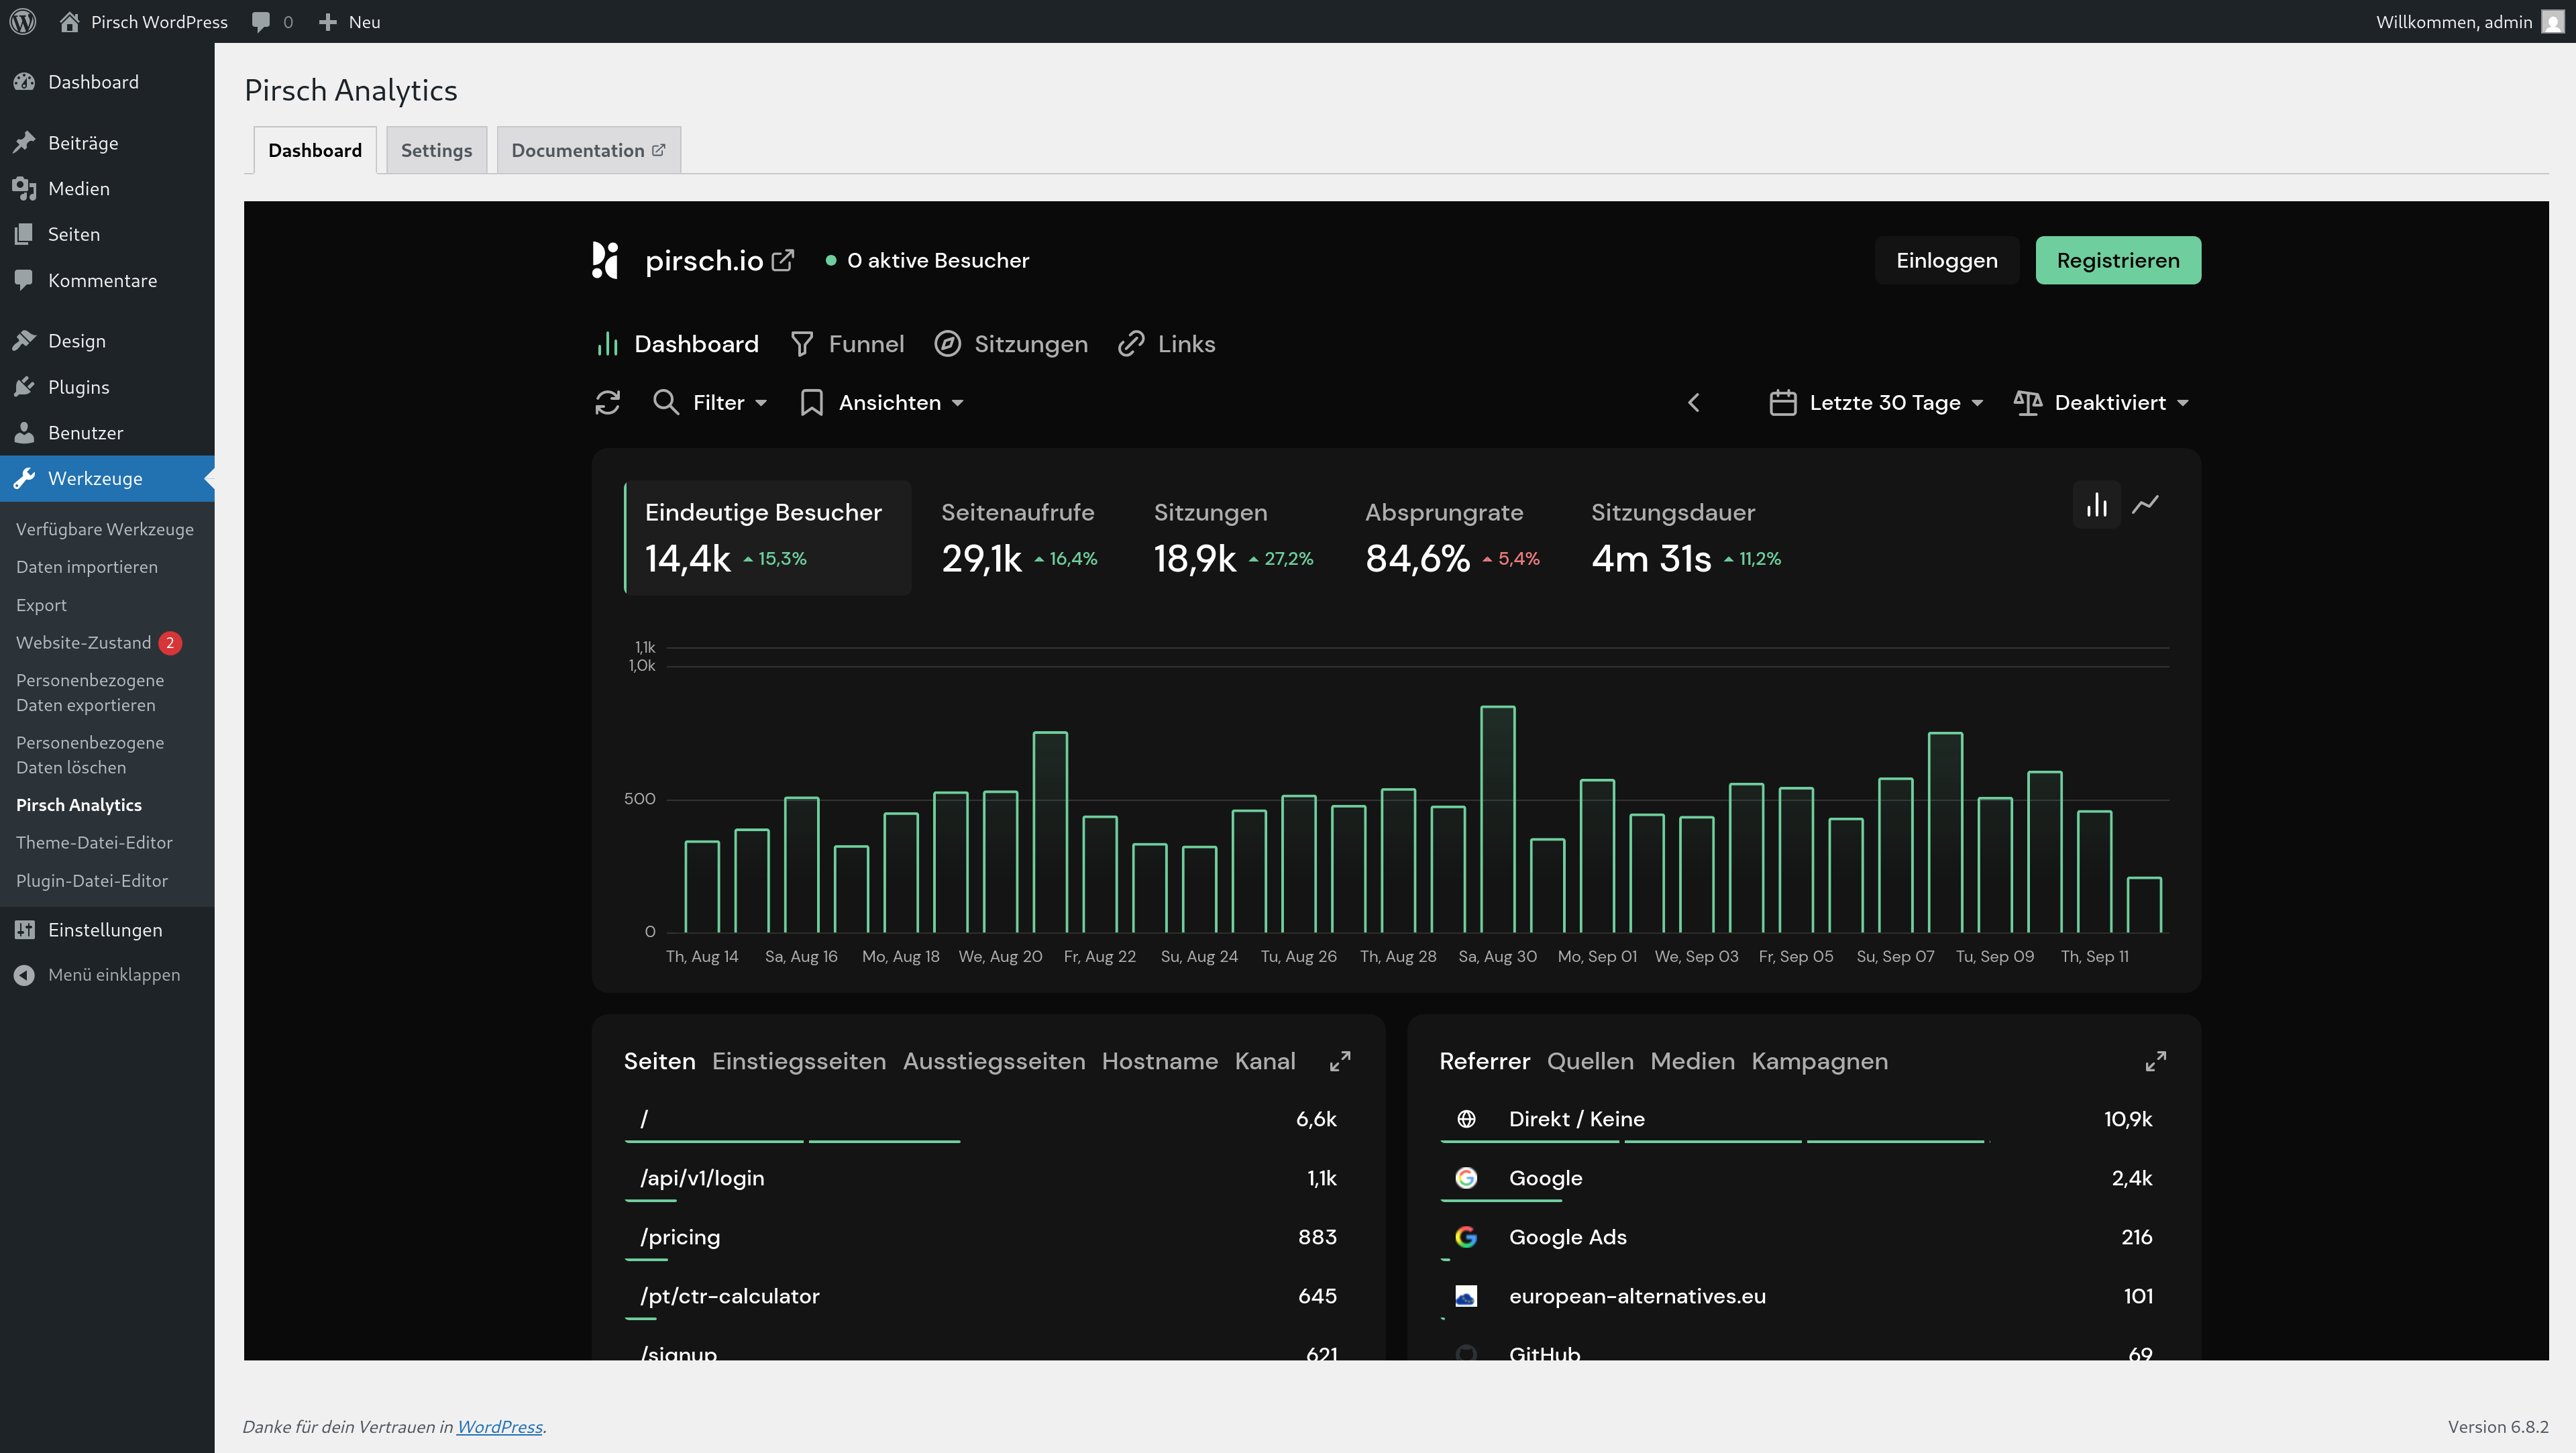
Enhanced Control Options
- Global Tracking Toggle: Disable tracking entirely with a single click
- Logged-in User Toggle: Choose whether to track logged-in users or exclude them from your analytics
- JavaScript Snippet Option: Now supports both, server-side and client-side tracking methods, or you can combine both of them
Smart Filtering
- Automatic Favicon Filtering: favicon.ico requests are now filtered out by default, giving you cleaner analytics data
- Improved Page Path Filter: Enhanced filtering capabilities for more precise tracking control
Redesigned User Interface
We've completely overhauled the plugin interface to be more intuitive and streamlined. The new UI makes configuration faster and more user-friendly.
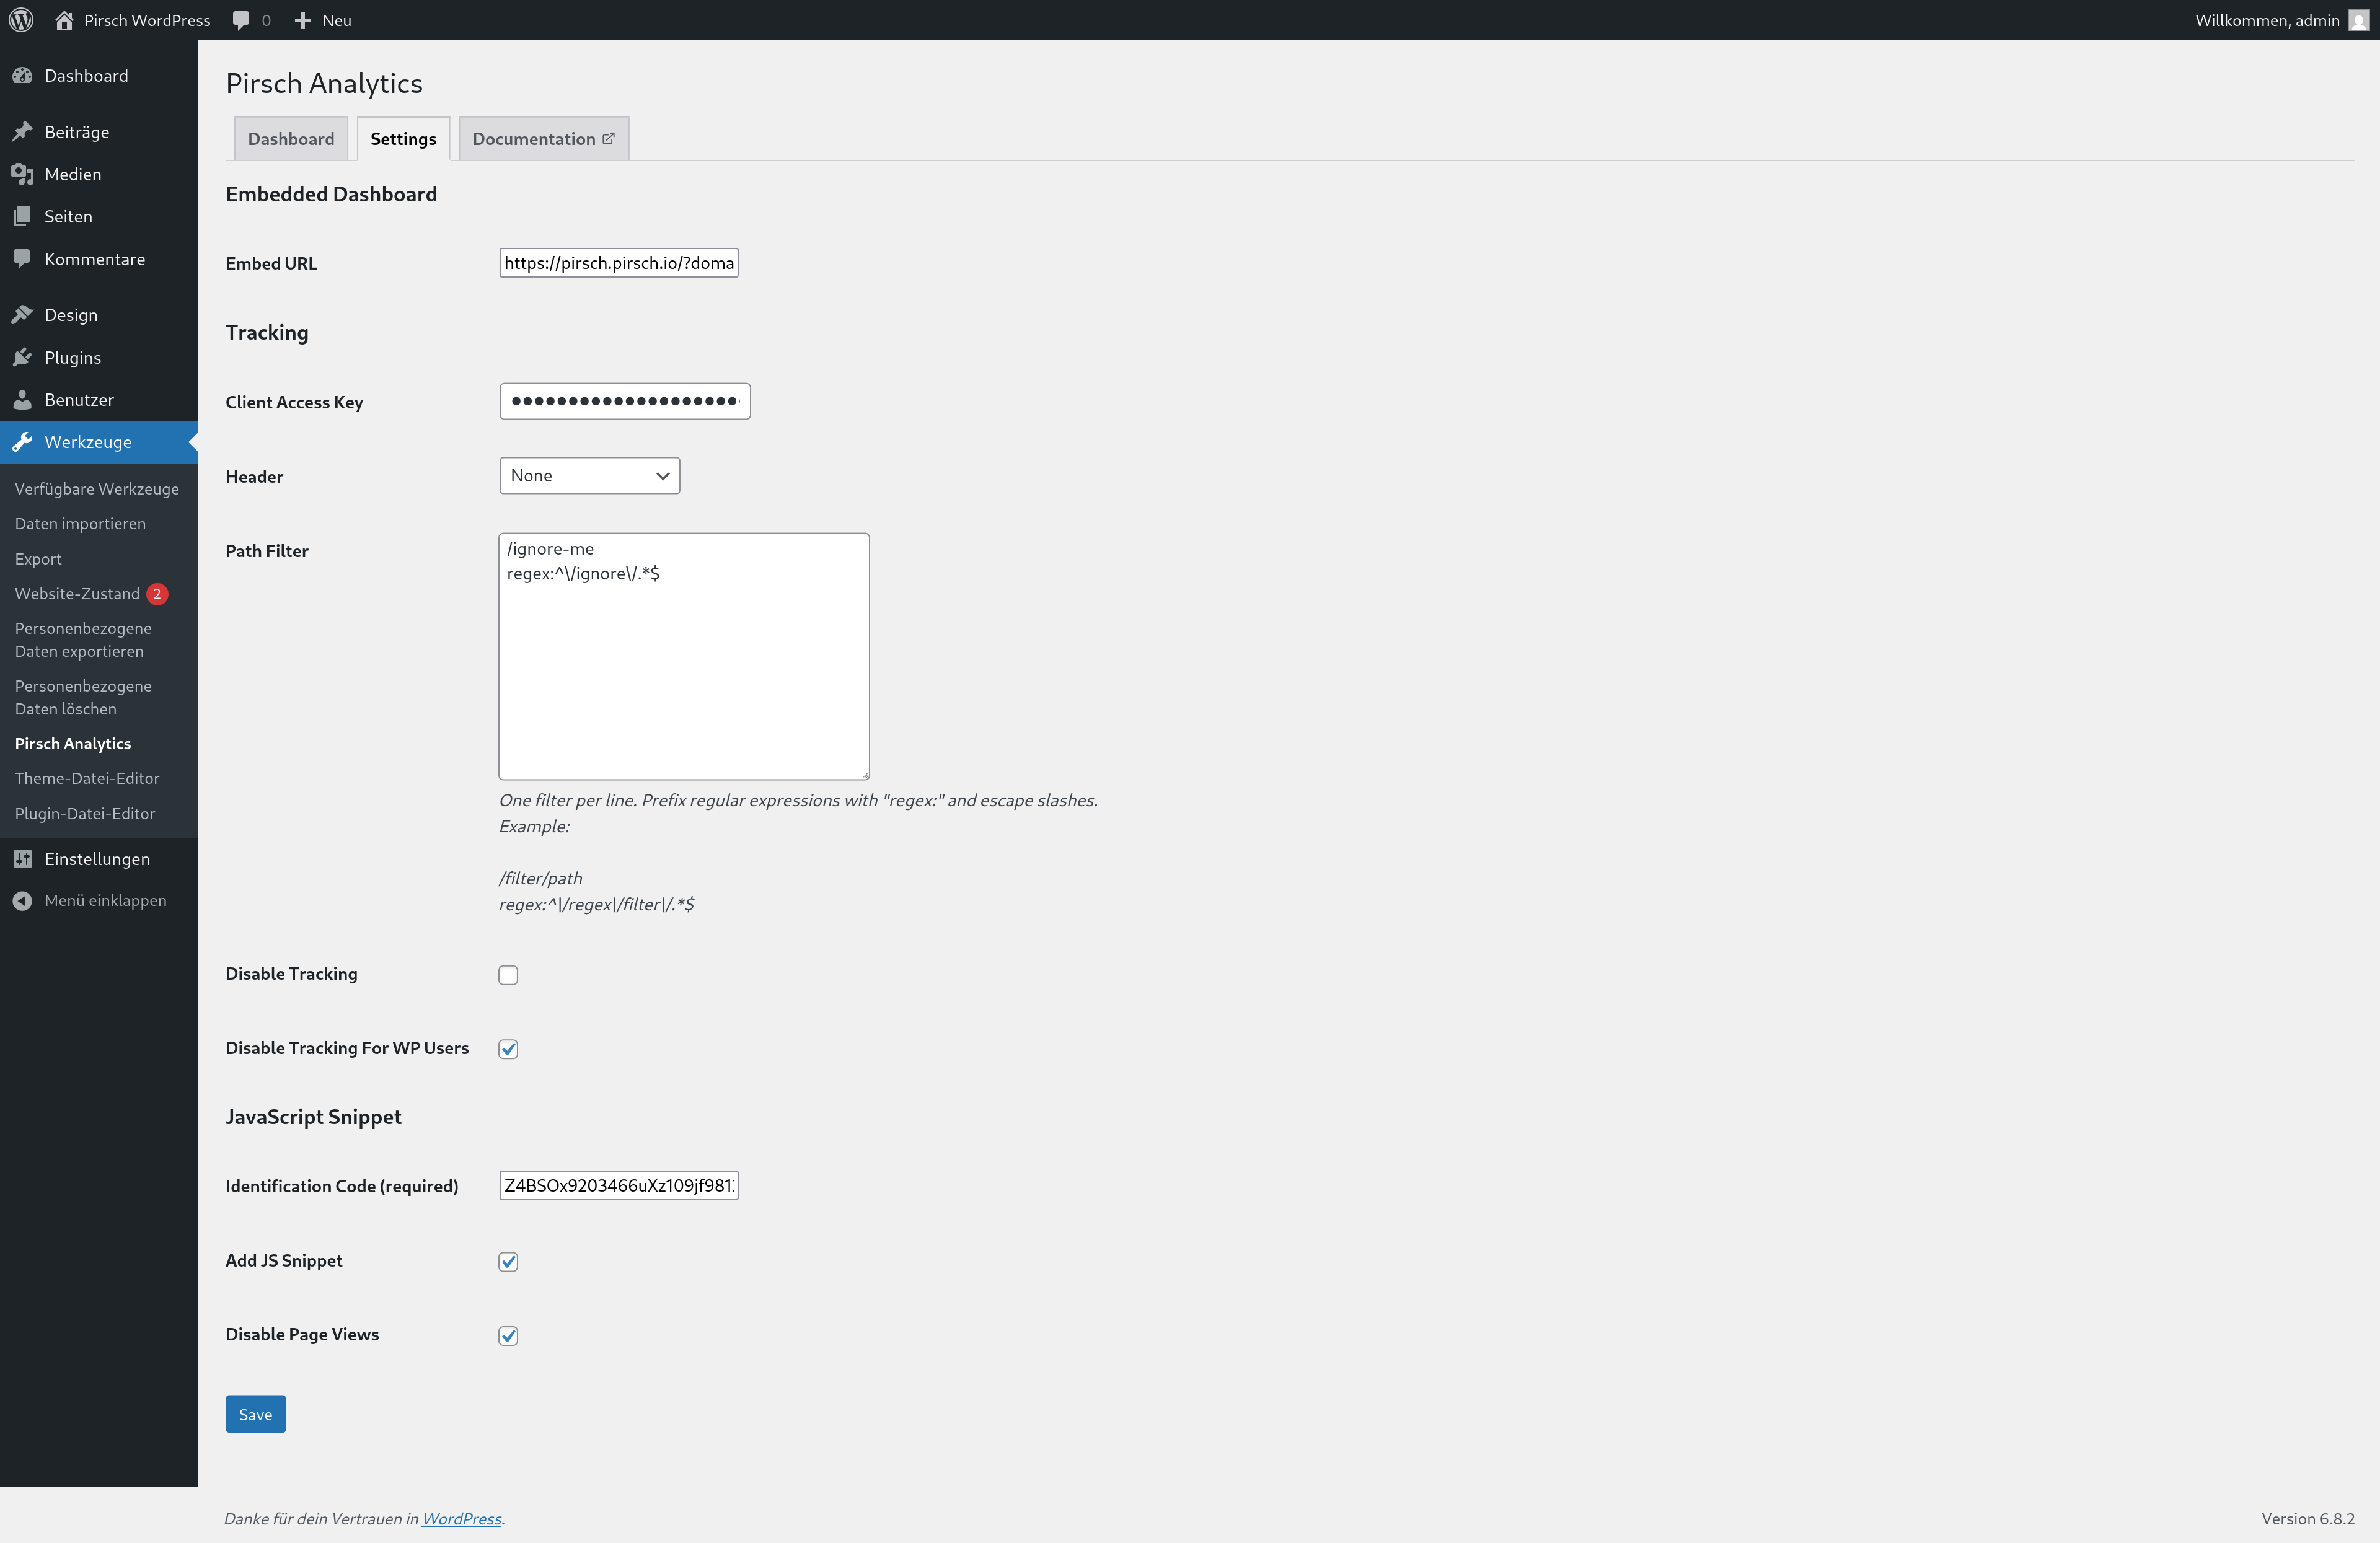
Simplified Authentication
Breaking Change: We've removed the client ID + secret authentication method in favor of the simpler and easier-to-use access keys system. You now only need to create a client using an access key on the Integration Settings Page instead of a full oAuth client.
Critical Fixes
- Caching Plugin Compatibility: we ensured that the plugin now works with caching plugins like WPRocket and others
- Proper Cleanup: Fixed an issue where plugin settings were incorrectly removed during deactivation instead of uninstallation, ensuring your configuration is preserved when temporarily disabling the plugin.
- Proxy Header Support: Enhanced support for X-Forwarded-For and Forwarded proxy headers, ensuring accurate visitor tracking behind reverse proxies.
Upgrade Instructions
Important: Due to the authentication changes, you'll need to:
- Update to version 2.0
- Replace your old client ID + secret with a new access key from your Pirsch dashboard
- Review your new tracking options and configure them according to your needs
Get Version 2.0 Now
Update through your WordPress admin dashboard or download directly from the WordPress plugin repository.
Also if you like it, feel free to leave us a review :)
Noindex, URL Shortener and Bot Filter Improvements
25. August 2025
This update introduces an option to disable search engine indexing for your dashboards. This new option was previously only available when a custom domain was configured, but is now accessible via the public access settings too. Toggle this option to disable search engine indexing for a dashboard.

The URL shortener has been modified so that the redirect URL now includes the UTM parameters and referrer. Previously, this information was only available on your Pirsch dashboard and not on your website after the redirect. This change means that you can now also track the UTM parameters directly on your website.
The API now allows disabling the bot filters entirely. To do this, set the disable_bot_filter option on the request for a page view, custom event or session extension. While we do not recommend doing this by default, it can be useful if you are using Pirsch in a well-controlled environment, such as an app or desktop application.
You can find the full changelog in our documentation.
Remove the Anchor from URLs
27. June 2025
You can now strip the anchor from URLs using a new snippet option. To enable it, simply add the data-strip-anchor attribute to the snippet (also available from the advanced options menu on the integration settings page).
We also fixed the query parameter option removing the anchor from the URL before sending it to our service. No matter whether the option is set, the parameters are never stored.
You can find the full changelog in our documentation.
Quality of Life Improvements and Bug Fixes
24. June 2025
This smaller update includes quality-of-life improvements and bug fixes.
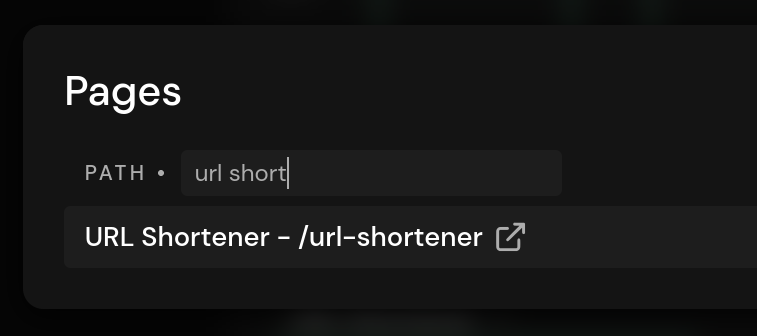
- Creating links with the URL shortener now supports autocompletion.
- The data-download-extensions and data-disable-history options, which were missing, have been added to the snippet integration settings. data-download-extensions allows you to set custom file formats to be tracked with the standard file download event, and data-disable-history allows you to disable sending page views on history navigation. This is used by most JavaScript router libraries, SPAs, and PWAs.
- The link statistics were missing the configured parameters. For example, if you set the referrer, the results showed everything for the link event, not just the event + referrer.
- We've fixed the separator for the conversion goal regular expressions in the URL, which could cause some expressions to set the filter incorrectly.
You can find the full changelog in our documentation.
Non-interactive Events, Autocompletion, Quality-of-Life Improvements, and More
21. May 2025
Non-interactive Events
We now support non-interactive custom events. They are created by simply adding the non_interactive parameter in JavaScript. There are also options for the API, HTML attributes, and CSS classes.
Unlike regular events, a session will be counted as bounced if there are no subsequent page views or events without the parameter set.
More Dashboard Customization Options
The dashboard now offers more fine-grained customization options. You can disable individual parts of the filter bar and the live view option.
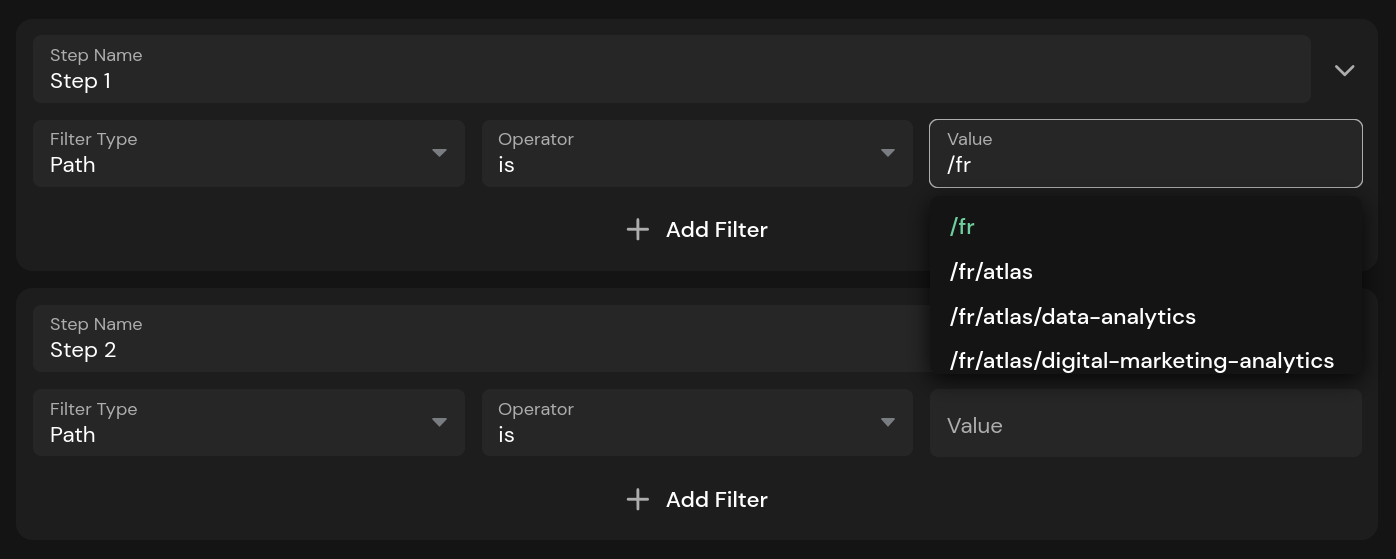
Autocompletion for Funnels and Conversion Goals
Creating funnels and conversion goals used to be error-prone because you had to type in the exact value you wanted to filter for. This process has now been greatly improved with autocompletion for all filter fields.
Browser and OS Filters in Funnels
The filter options for the browser and operating system were missing from the funnels. This has now been fixed.
Going Back in the Graph
Another quality-of-life improvement is the new button that allows you to return to the daily view when filtering by hour. After selecting a time on the graph or choosing a start and end time from the drop-down menu, you can click the up arrow to return to the daily view.

Start the Week on Monday or Sunday
A new setting has been added that allows you to start the week on Sunday instead of Monday. Monday is the default, but Sunday is more common in the U.S. and a few other countries, so now you can choose which day the week should start on.
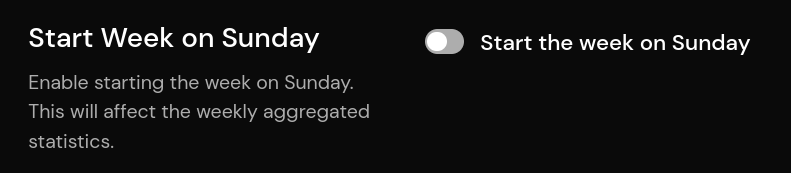
This change will affect the weekly statistics. Visitors who previously visited on Sunday and were assigned to the previous week will now count towards the current week.
Custom Comparison Mode Dates
The custom date fields for comparison mode no longer enforce specific dates. For example, selecting a period longer than the current one previously set the dates to match the length of the current period. This is no longer the case, and you can now choose any period.
However, this also means that you need to ensure that the comparison makes sense. For instance, comparing a week to the previous month might not make much sense, but it's now possible.
Other Changes and Improvements Worth Mentioning
- We've added documentation links to empty pages in cases where no dashboard, funnel, or link has been created yet
- Greatly improved bot filtering using a custom IP block list (GDPR-compliant, of course)
- Improved query performance
We hope you enjoy this release! Please let us know if you encounter any problems or have any questions.
You can find the full changelog in our documentation.
Organizations renamed
12. April 2025
In this quick little update, we've renamed Organizations to Teams because that's a more commonly used term.
If you haven't used Teams yet, you can find more information on our updated Teams documentation page.
Major Update That Fulfills Your Wishes
07. April 2025
We are pleased to announce the next major update for Pirsch! This time we tried to incorporate as many of your requests as possible. Let's get started!
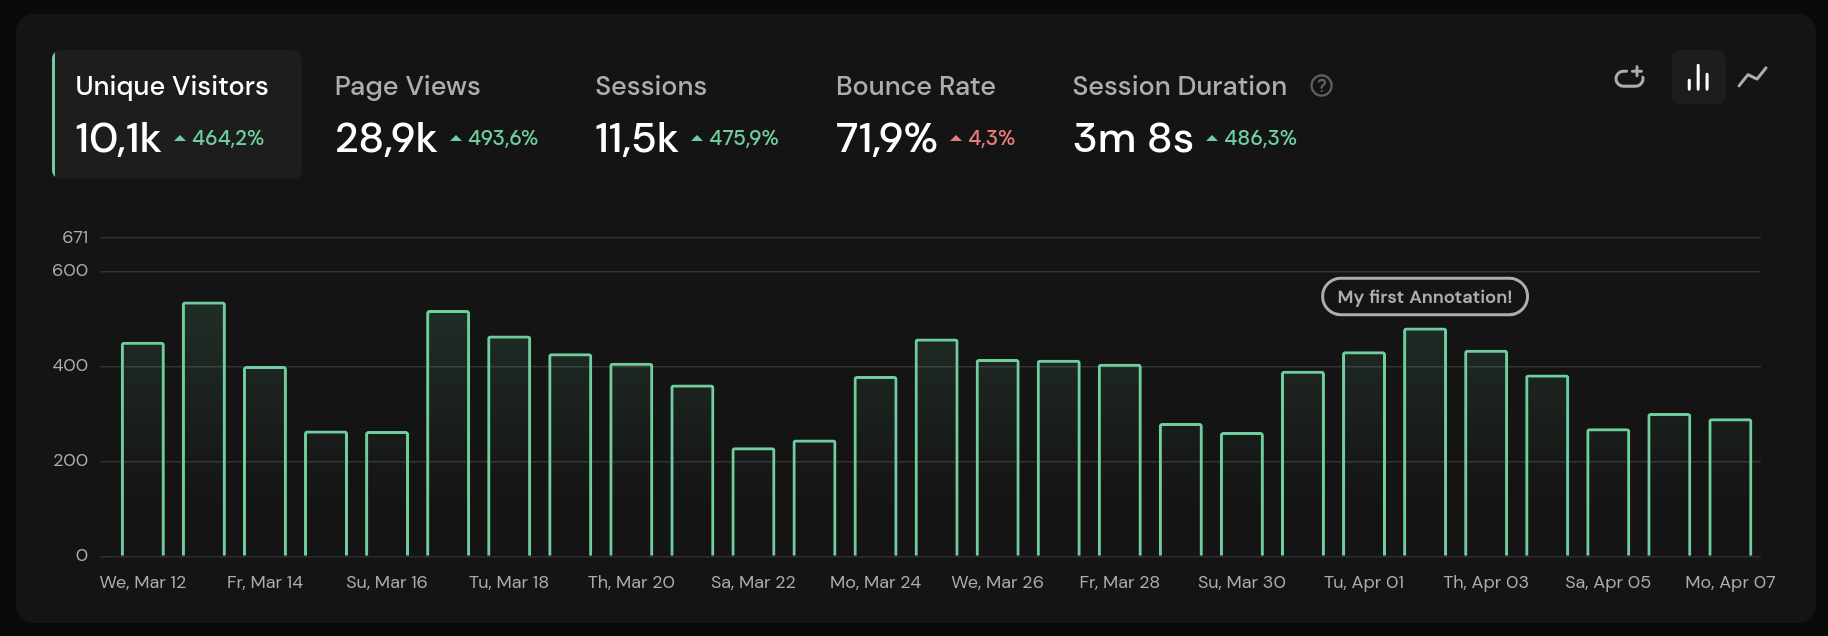
Annotations in the Top Graphs
Annotations can now be added to the top graphs to mark important milestones, events, or anything else you want to highlight! Simply click the Add Annotation icon to create a new annotation, enter a label and select a time.
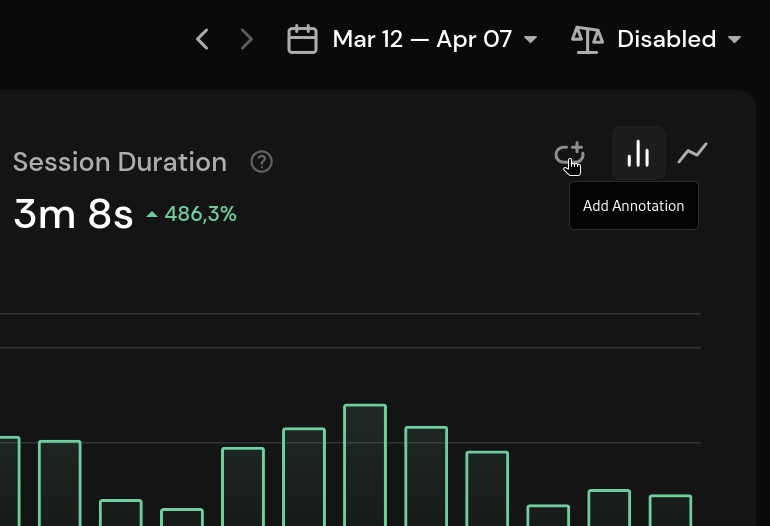
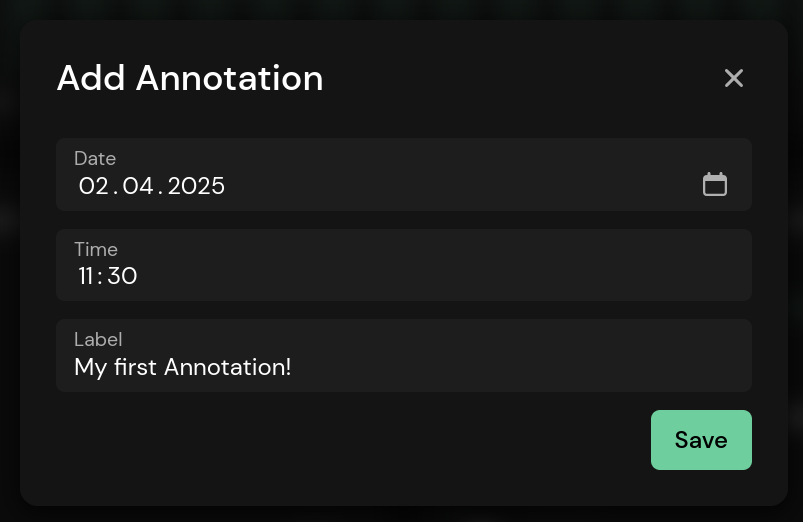
Once the annotation is created, it appears on all graphs. They work to the minute. You can click an annotation to see a list of all annotations for that day, and then edit or remove them.
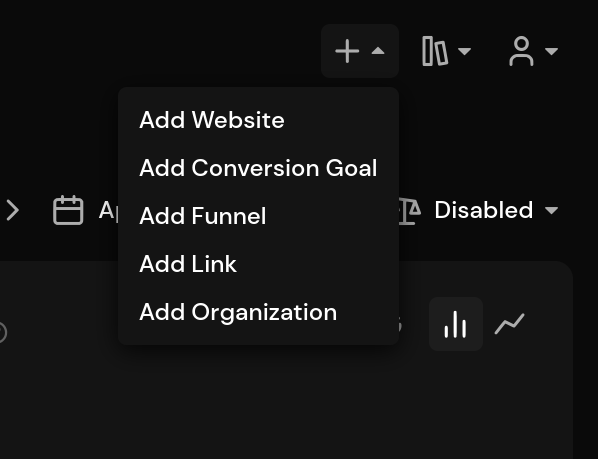
Create Conversion Goals From the Top Drop-Down Menu
Conversion goals can now be created from the dropdown at the top. Simple, but effective!
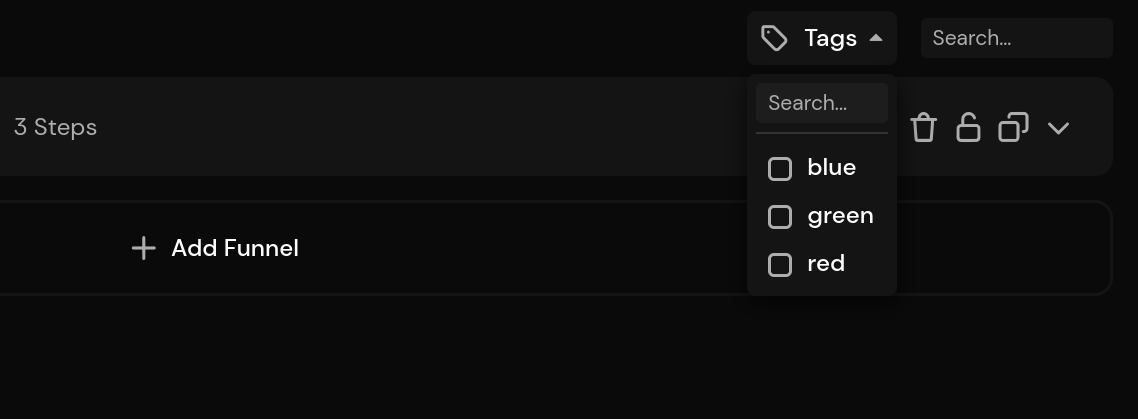
Filter Funnels and Short Links
To make organizing your funnels and short links easier, you can now filter them by tags. You can search for and select one or more tags from the new dropdown on the funnel and link pages. It's also possible to search for a funnel or link directly by typing a tag in the search field next to the dropdown.
AI Traffic Channel
A new traffic source channel for AI has been added. You can find it in the Pages panel of the main dashboard. This will make it easier to see traffic coming from ChatGPT, Claude, Perplexity or most other AI tools. If we've missed a tool, please contact support and we'll add it.
Please note that we filter out bot traffic. The AI channel contains human requests with an AI as the referrer.
DuckDuckGo Browser Detection and Icon
We now detect the DuckDuckGo browser and display an icon for it.

Hourly Filter
If you have selected a specific hour of the day from the time period selection or by clicking on the graphs, it will now display the selected times. You can also use your arrow keys or the arrow icons to move through a single day.
Filter Name Changes
We've renamed the includes and excludes filters to contains and not contains respectivly to make them easier to understand.
Other Changes
Here are some other notable changes:
- Signing in on a custom domain now displays a neutral meta title and description instead of the Pirsch brand
- Filter options are now loaded as you type. This allows access to all filter options, not just the top 1000
- Session cards now show the year instead of just the day and month the session was created
- Session cards no longer show the exit page if the session was bounced (same as the entry page)
You can find the full changelog in our documentation.
Euro Subscriptions
19. March 2025
This upcoming change will only affect you if you live in a Euro country and have a US dollar subscription.
From next month, if you live in a Euro country, you'll have to pay in Euro. The subscription dialogue was a little confusing as USD was pre-selected regardless of your country of origin. This led EU customers with the Euro as their official currency to subscribe in dollars.
The dialogue has been updated to make it clearer and less prone to error. If you live in a Euro country and currently pay in dollars, we'll send you a notification that your subscription is being updated. Previous payments will be unaffected, only future payments will change.
The main reason we're starting to enforce this is that we lose about 10% of a payment in currency conversions. The dialogue was never intended to offer the option to pay in dollars if you live in a Euro country. However, we will keep our promise not to raise prices in 2025.
We hope you understand the reasons for this change. If you have any questions, please contact support.
Imports Fixed
19. February 2025
We've fixed a few issues with long running data imports from Google Analytics, Plausible, and Fathom.
If you have started an import recently, please run it again. Should you run into any problems, please reach out to our support.
You can find the full changelog in our documentation.
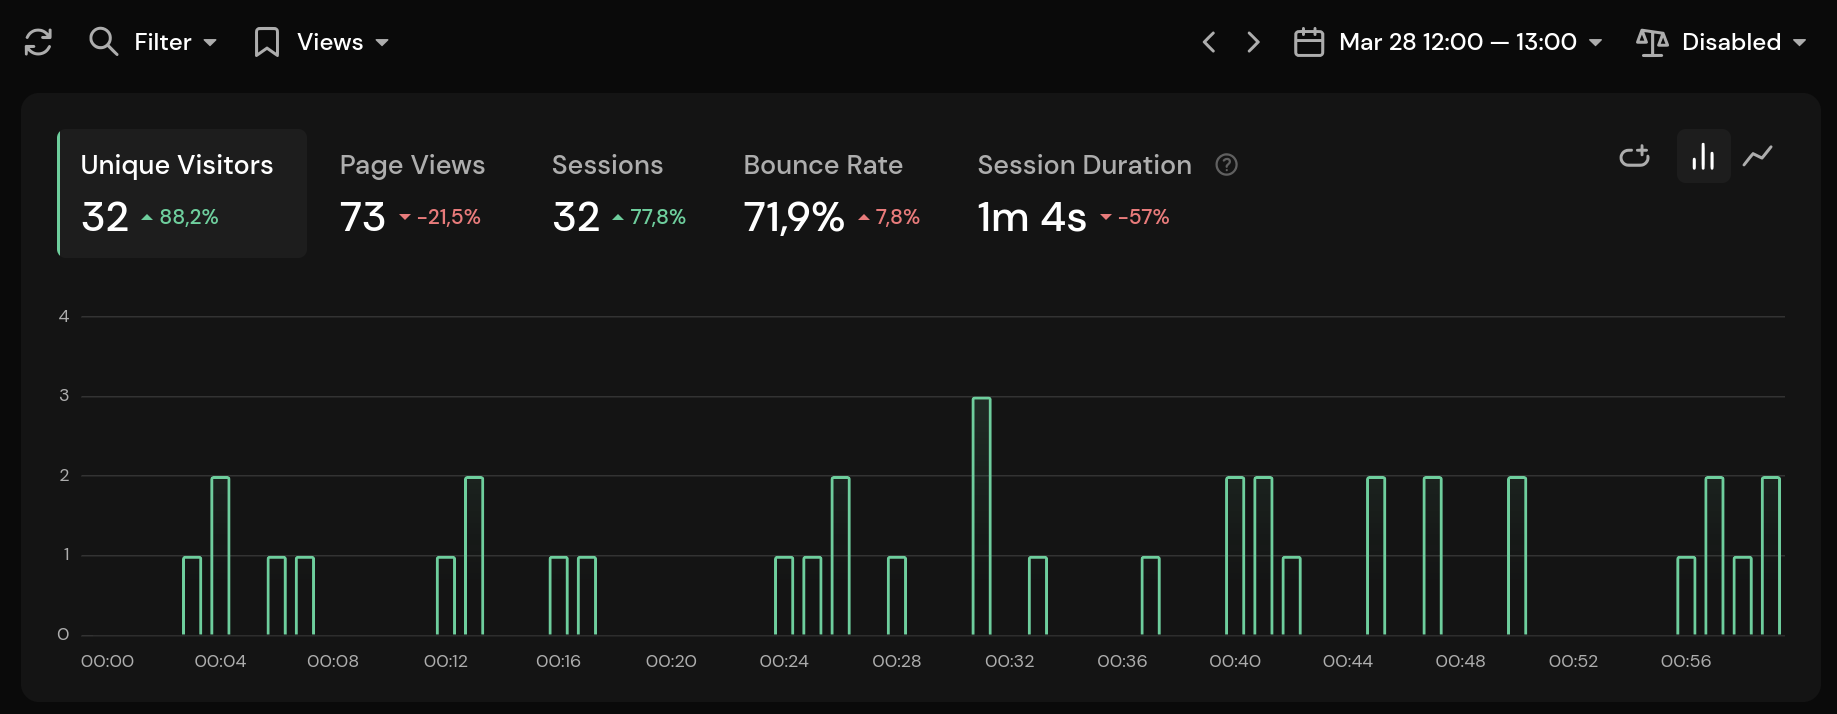
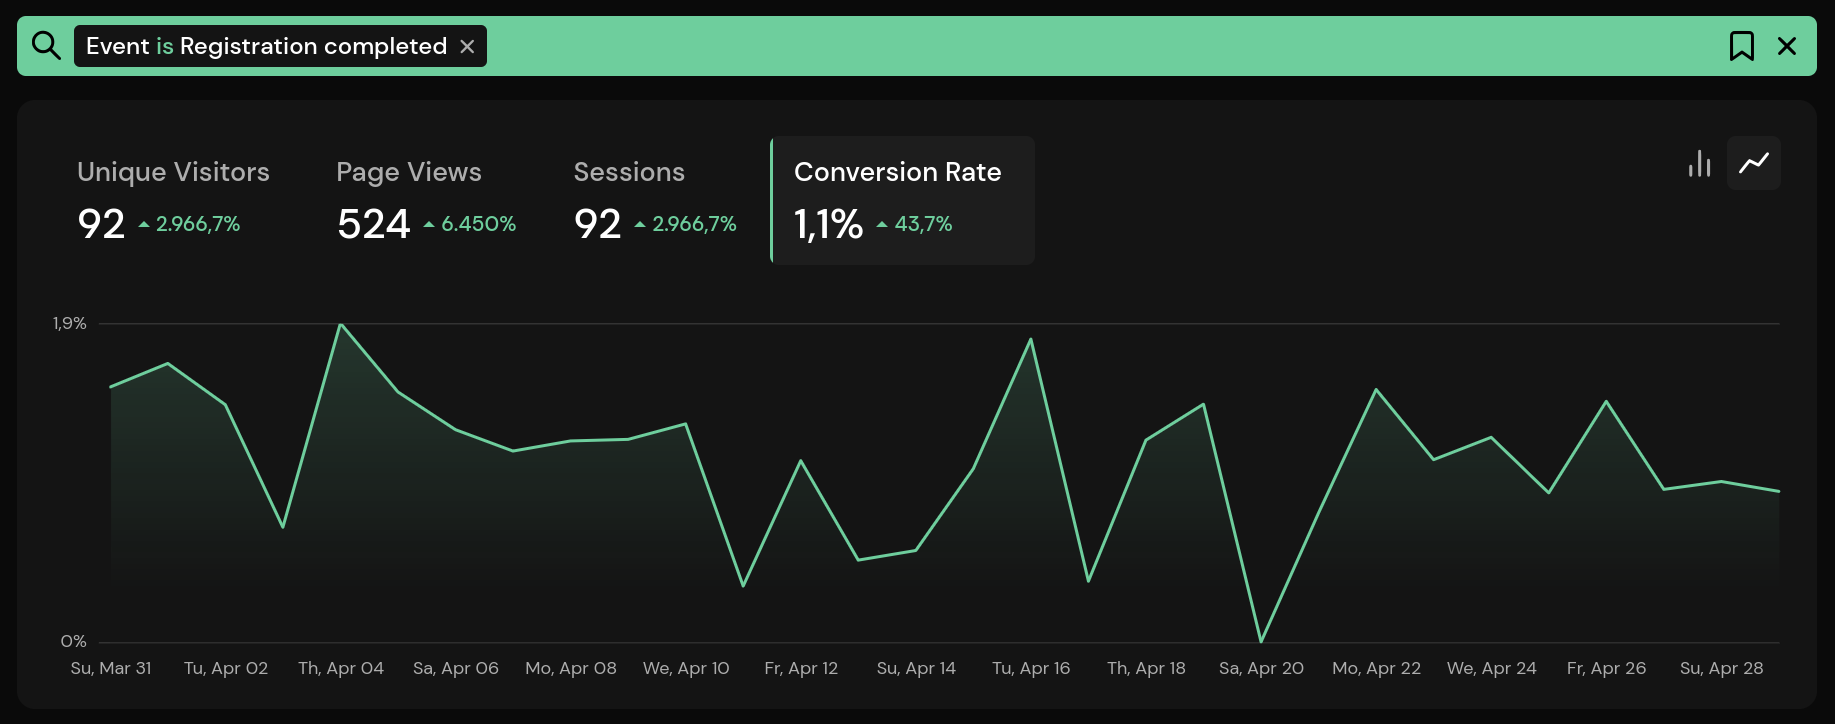
Conversion Rate Graph for All Statistics
10. February 2025
With this update, we're adding the conversion rate graph to all statistics. For example, filtering by country will now bring the CR graph to the top.
We also improved the bot filters, updated the OS data collection and fixed a few bugs. Including one where you couldn't see the CR graph on mobile.
You can find the full changelog in our documentation.
Integrated URL Shortener
19. January 2025
Happy New Year! This is our first major update of the year, and we're happy to announce that Pirsch now has a built-in URL shortener!
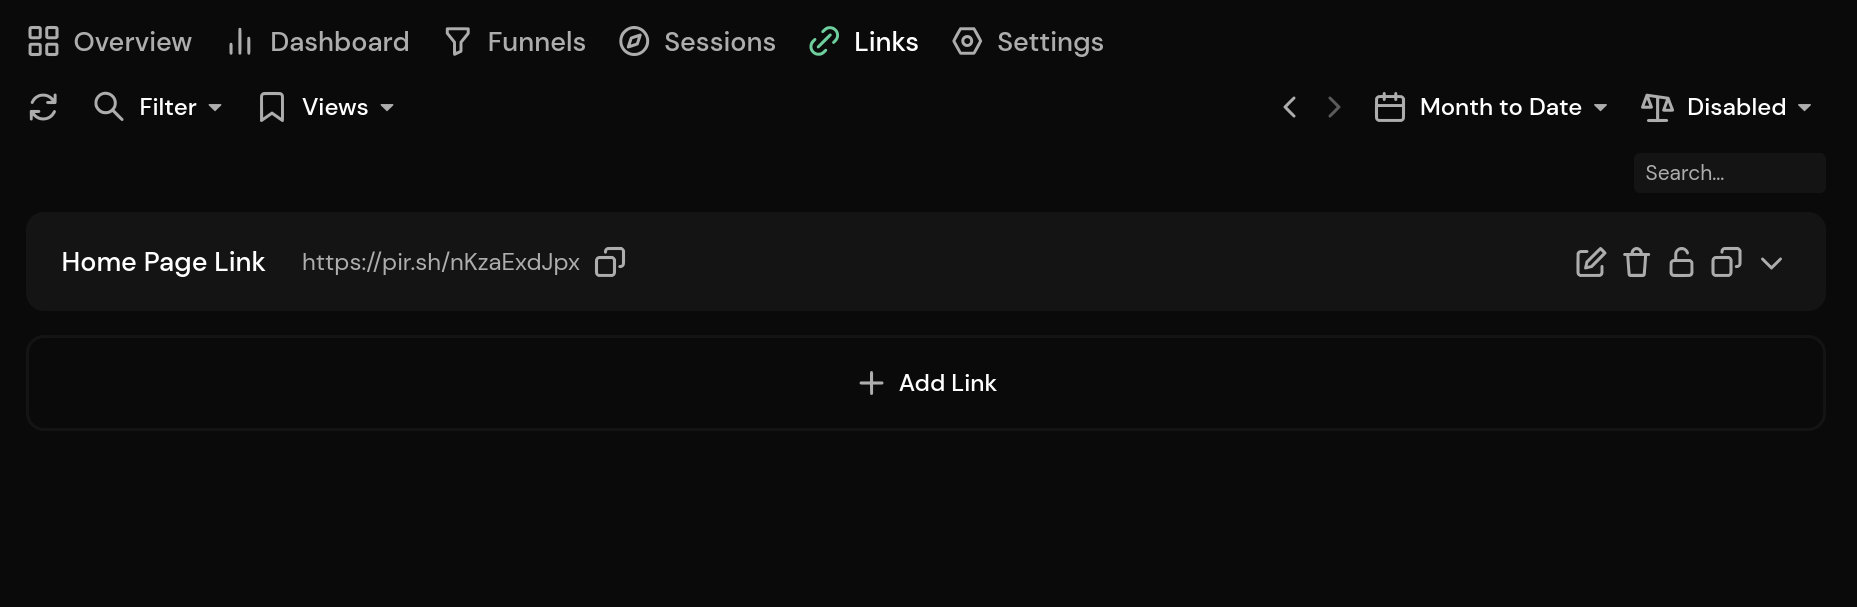
The newly added Links page allows you to create short links that reliably track the source and UTM parameters. Unlike other link shorteners, this one is directly connected to your dashboard, making tracking the traffic source accurate and giving you access to the information in the same dashboard as your regular analytics data. Third-party URL shorteners collect their own analytics data and rely on URL parameters to forward information that can be stripped by ad blockers and the like.
The URL Shortener is available to everyone. However, the Plus plan has some additional features. These are:
- Redirects based on country of origin, language and operating system
- Link expiration and redirection to a special page when expired
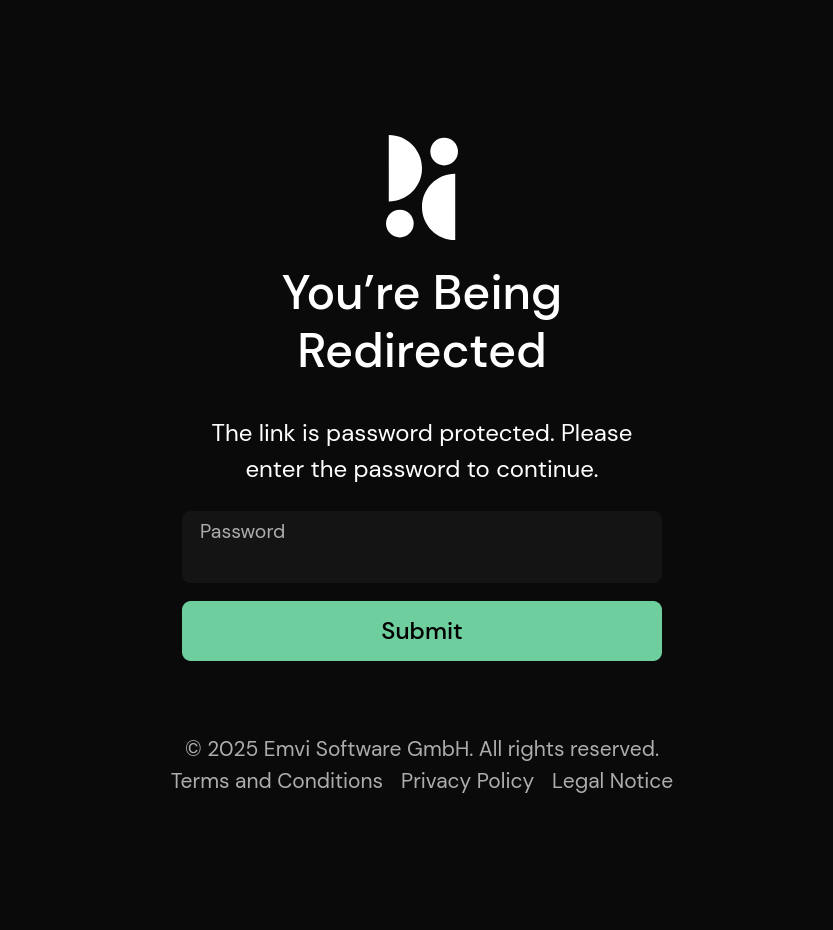
- Password protected links
- Webhooks
- Customizable meta title, description, and social media image
- Theming
The link dialog may look a bit intimidating at first, but for a simple redirect you only need to fill in the name and a URL. Here is an example.
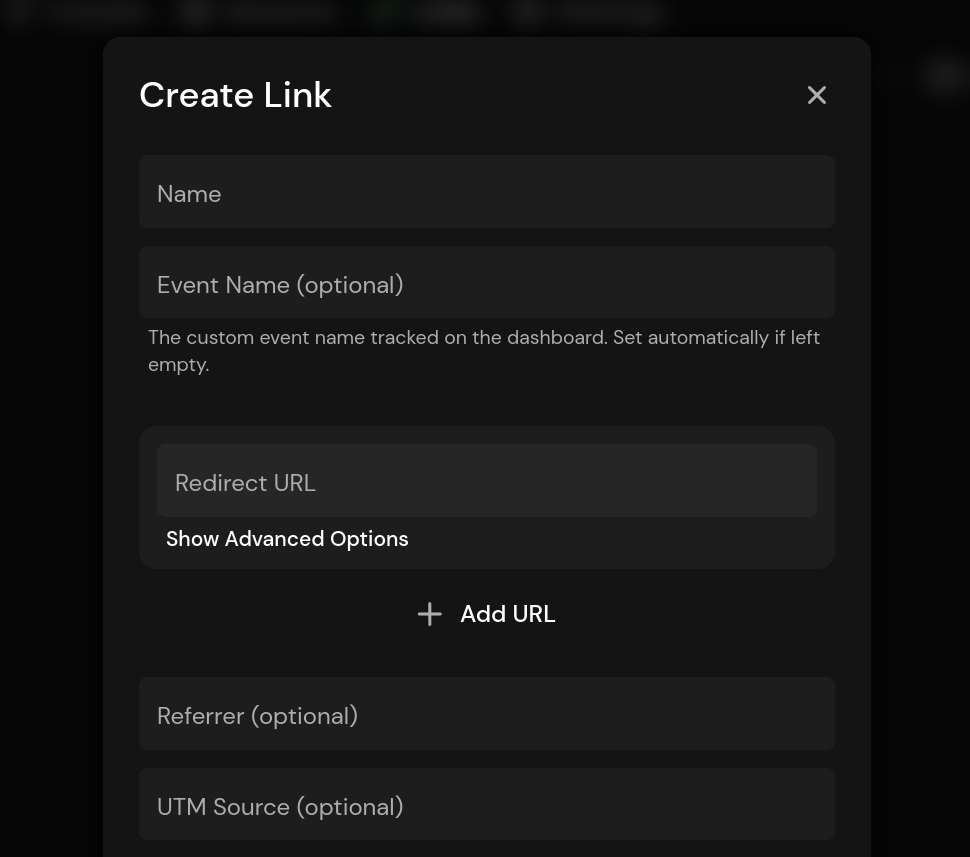
Once created, the link will be created as https://pir.sh/something. You can copy and share it.
We recommend to create one link per source. So, let's say you're running a paid ad campaign on Facebook. In that case, create a new link "Facebook Ad" and add "https://facebook.com" as the referrer and optinally set the UTM parameters (you can use our UTM generator if you like). For your LinkedIn ad, you should create a second link to differentiate them. When a visitor clicks on of the two links, the session will be created right on the redirect page, which is another benefit over other URL shorteners.
When clicking on a password-protected link, visitors are prompted to enter the password before being redirected. Otherwise, they are immediately redirected.
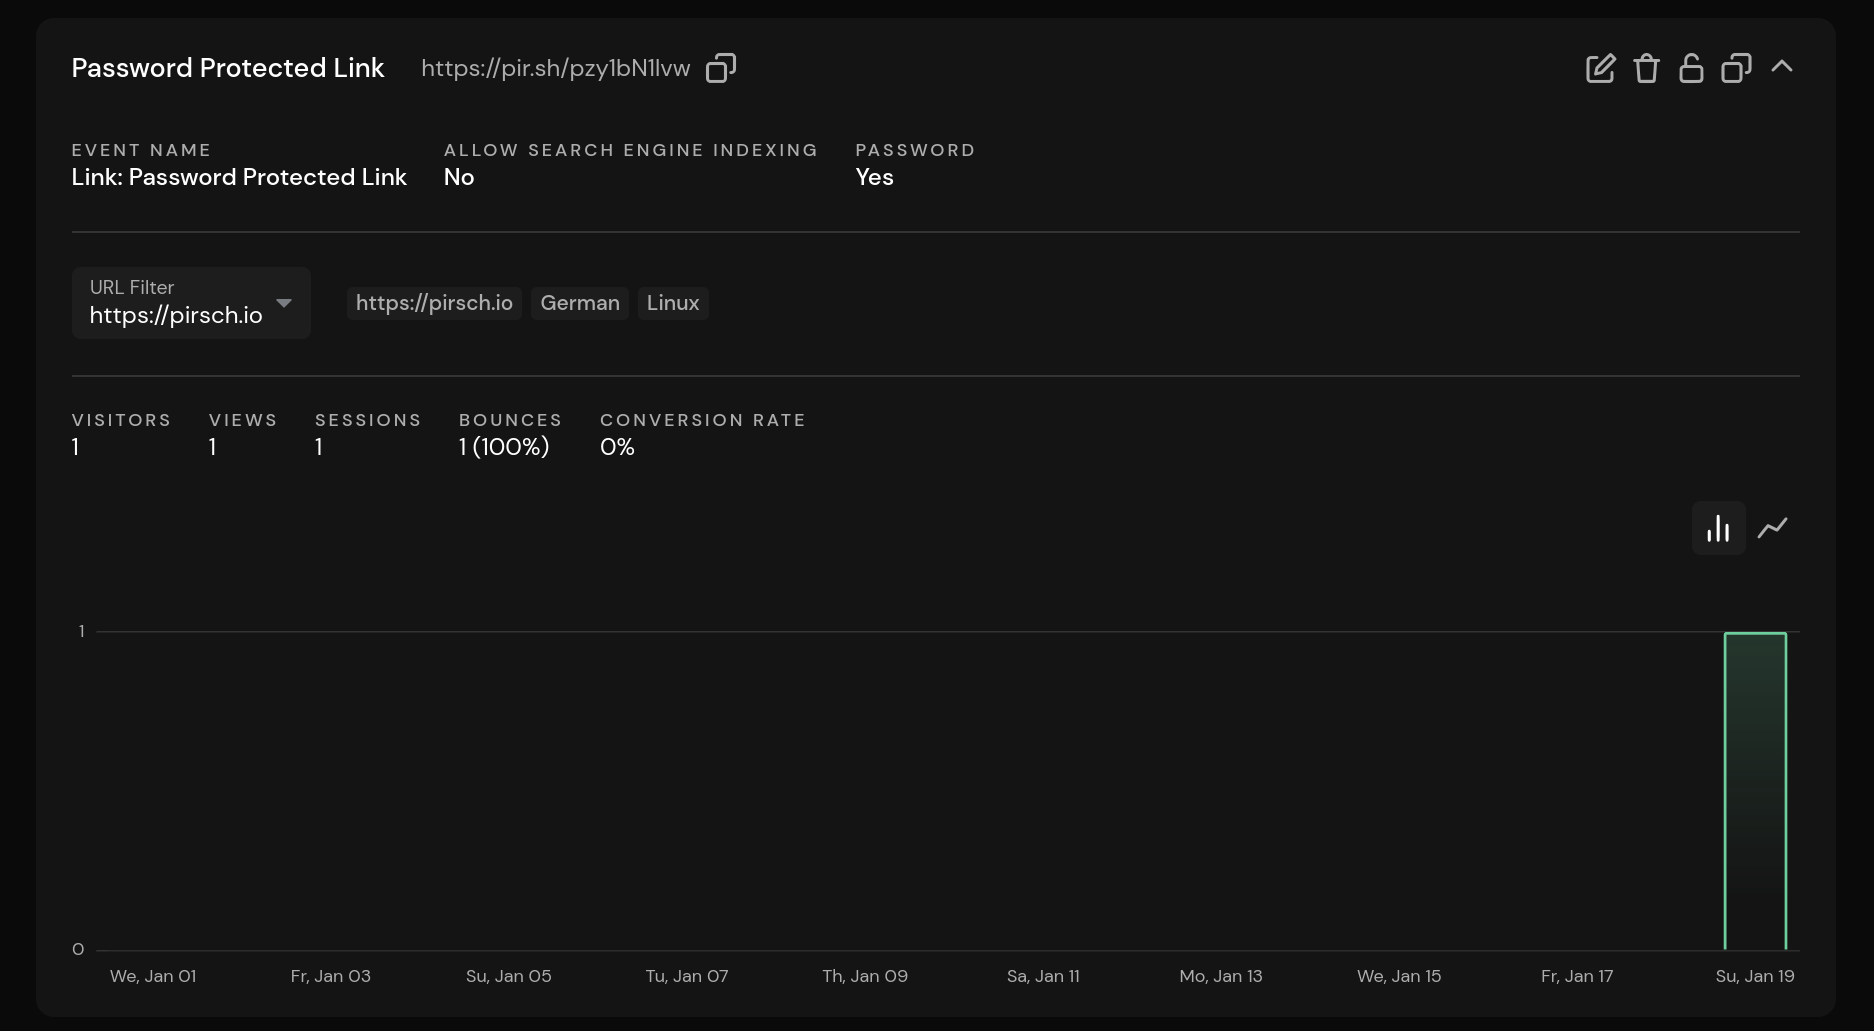
Clicks are tracked as regular custom events on the dashboard. Expanding the card on the links page will filter for the event and display the unique number of visitors. You can also select a specific URL to view the results.
Other Changes
Of course we also made some other changes. Funnels can now be tagged for better organization (you can enter a tag in the filter). Tagging also works for links. We also fixed the growth arrow in the chart tooltip, as it wasn't displayed correctly in some browsers.
You can find the full changelog in our documentation.
Hide the Logo Using Custom Themes
02. December 2024
With this update, you can now hide the logo in the upper left corner from the theme options. We also fixed the new tooltip on mobile devices.
You can find the full changelog in our documentation.
Major Update With Enhancements to Email Reports, Graphs and Source Attribution Channels
26. November 2024
The next major update for Pirsch is here, bringing new features and improvements!
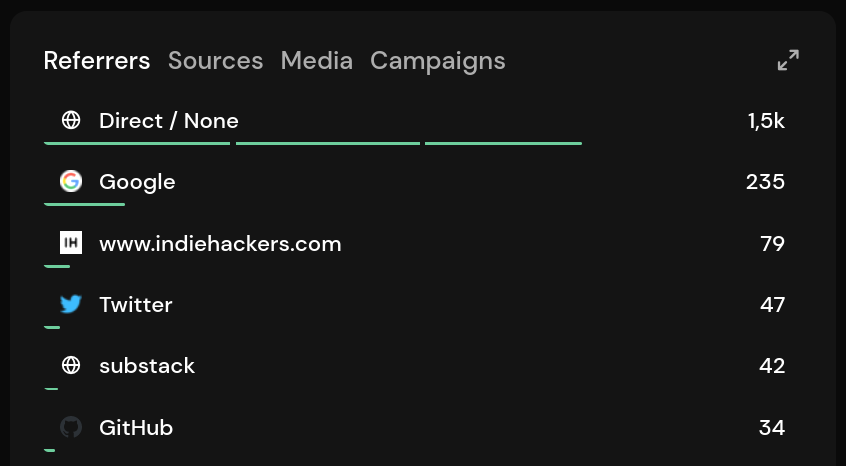
New Source Attribution Channels
Pirsch now supports source attribution channels. These work exactly the same as in Google Analytics 4 and can be accessed from the pages panel. Page views are now grouped based on referrer, UTM parameters and the newly added GCLID (Google Click Identifier) and MSCLKID (Microsoft Click ID). GCLID and MSCLKIDs are fully anonymised for GDPR compliance (in fact, we don't store them at all).
As usual, you can filter for channels by clicking on them in the list.
Improved Email Reports
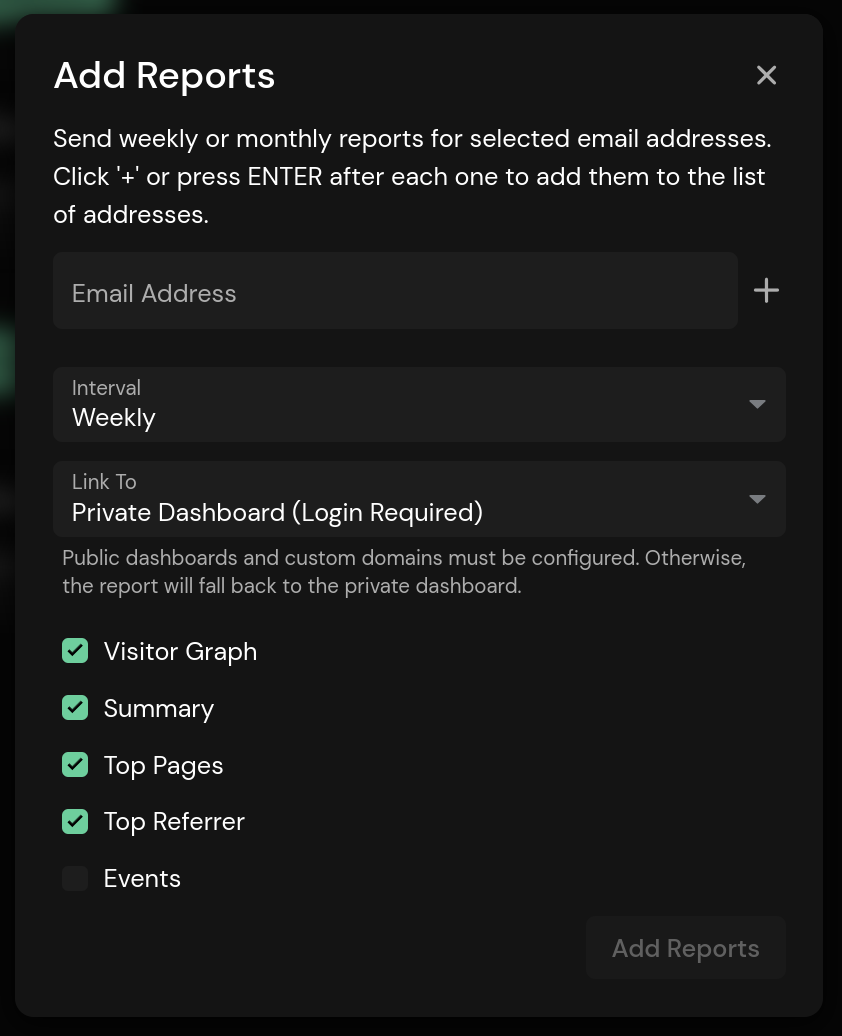
Email reports can now be customised. When creating or editing an email report, you can now choose from the following options:
- Visitor graph
- Summary
- Top pages
- Top referrer
- Custom events
We have also improved the chart and fixed an issue with daily reports where the date was displayed multiple times on the x-axis. Numbers are now formatted correctly throughout the report.
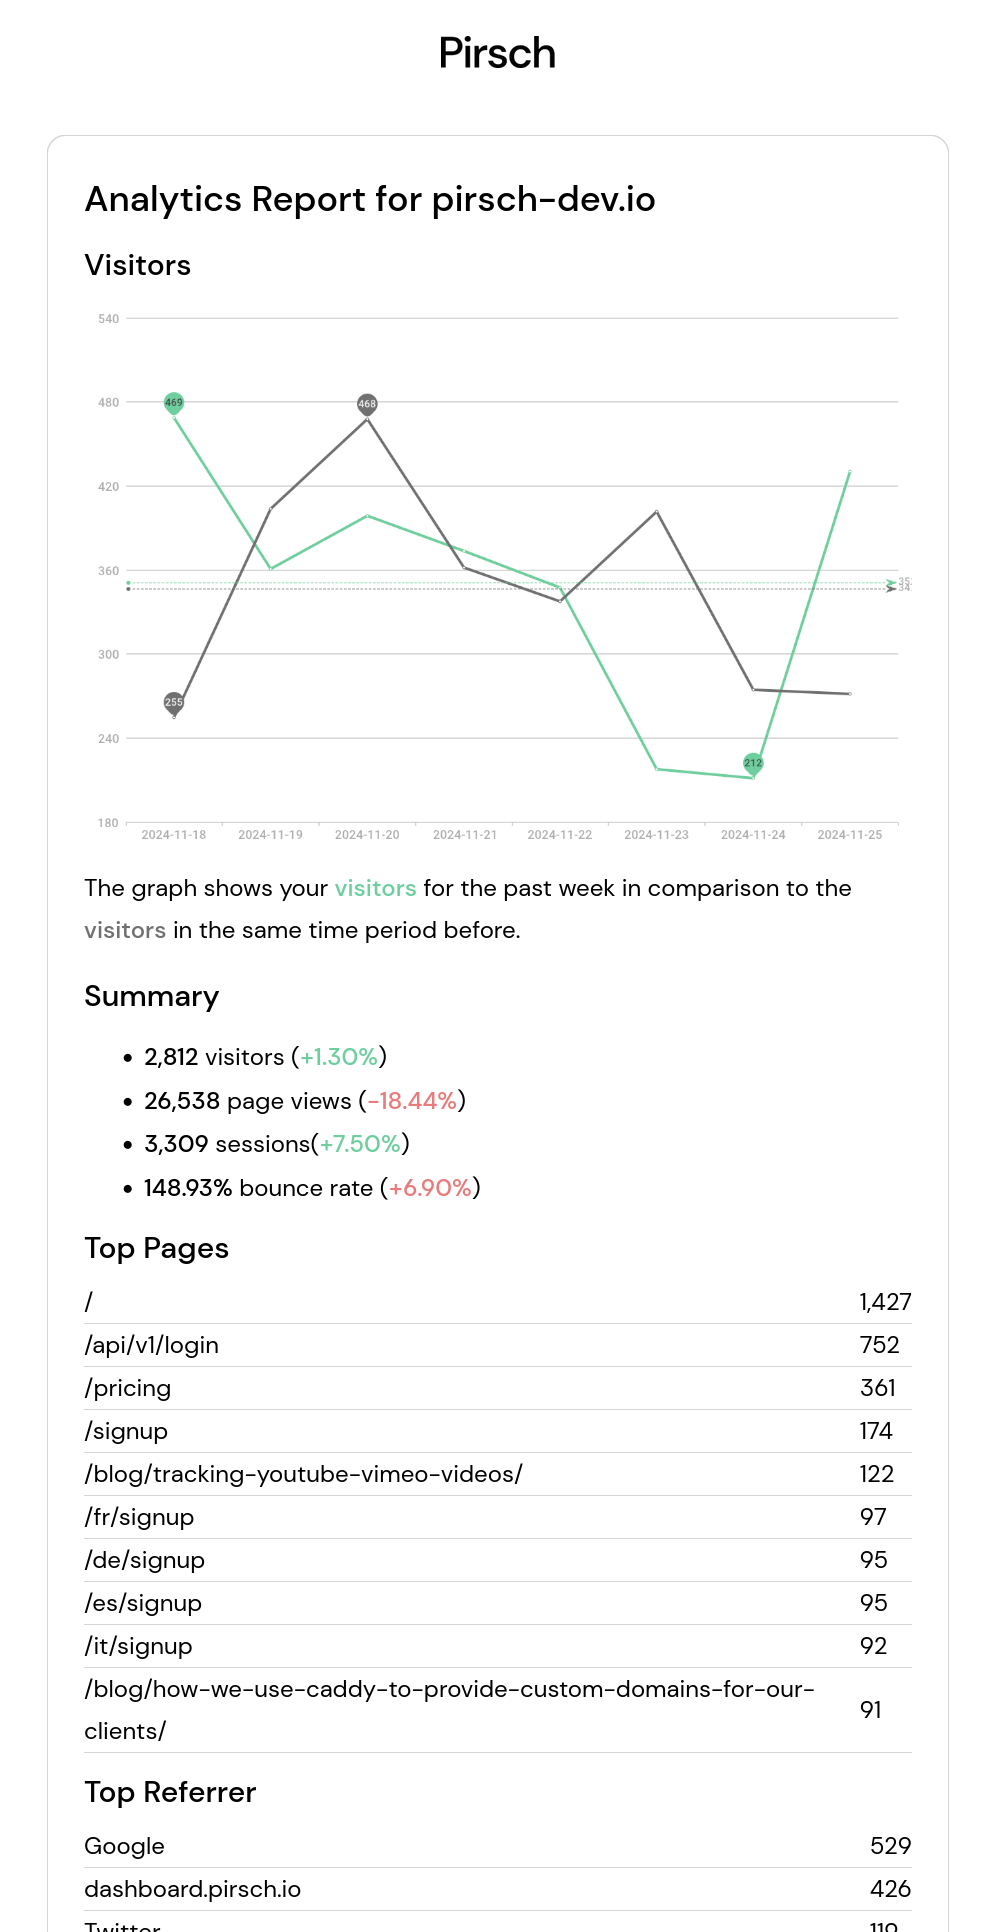
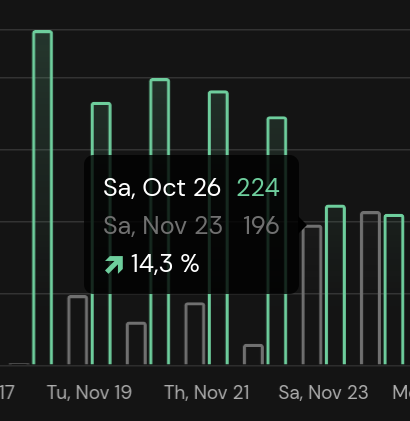
User Interface Improvements
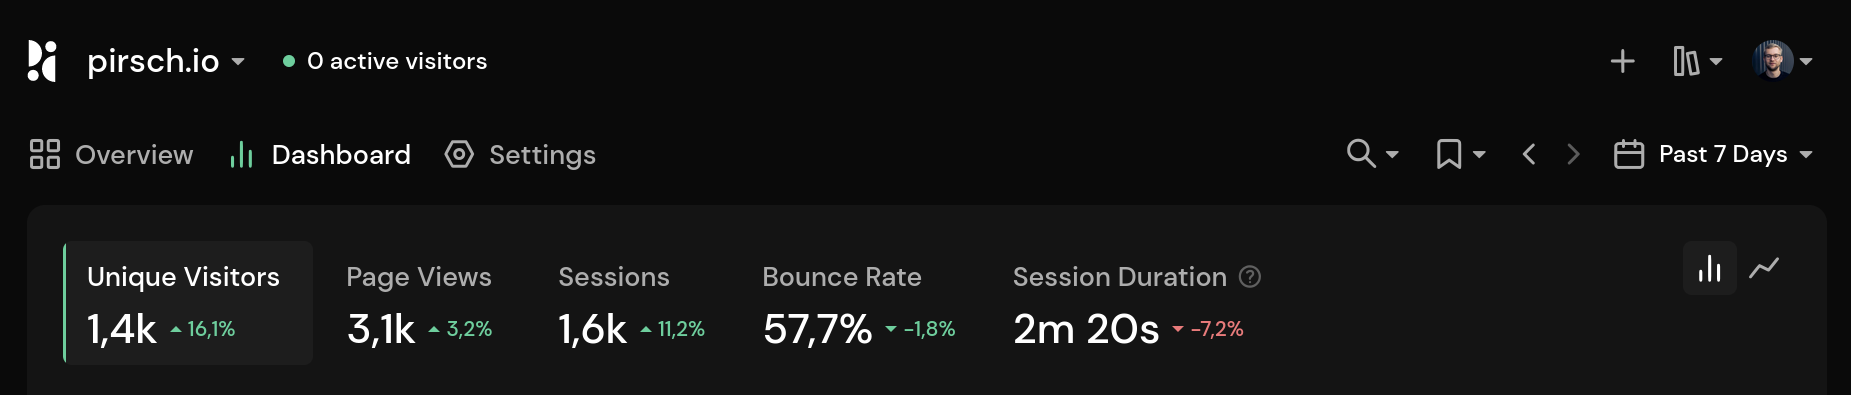
The user interface has received various improvements and a new tooltip for graphs. When you hover over the stats, you'll see the new custom tooltip, which not only looks nicer, but also shows the growth if you're in comparison mode.
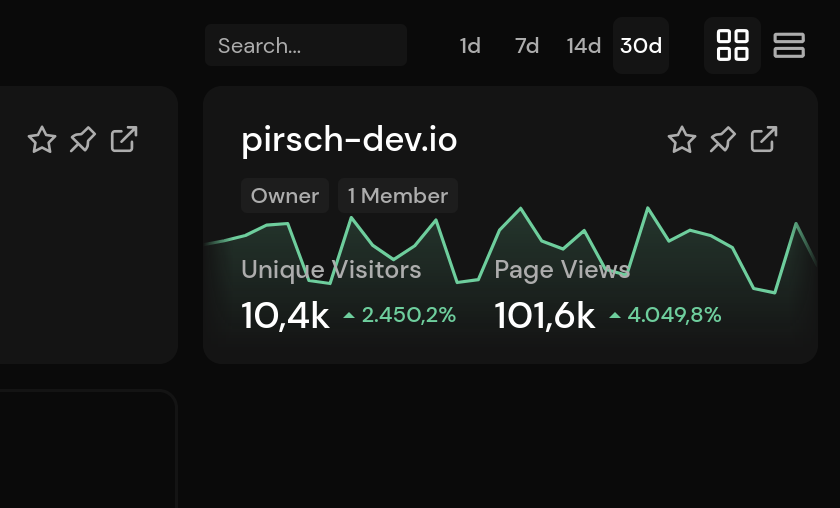
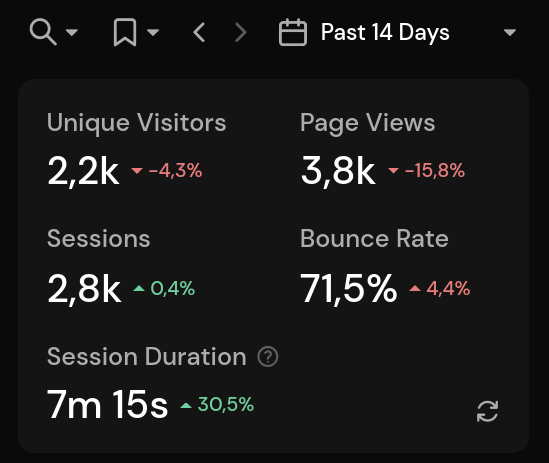
The overview now offers a choice of time periods. You can choose whether you want to see the last 30, 14, 7 days or today for all your sites.
Filters can now also be removed by pressing ESC on your keyboard. Previously this could only be done by clicking on the X or by removing each filter individually.
SEO
If you're sharing your dashboard publicly, you may want to disable search engine indexing for SEO. You can now do this by navigating to the custom domain settings and clicking the toggle.
Other Improvements
As always, we've fixed a few bugs and improved bot filtering. We hope you enjoy this release!
Please see our changelog to learn more.
Black Friday
Also, a quick reminder that we currently have a black friday deal for new customers. Add BLACKFRIDAY24 on checkout to get 25% off!
Black Friday Coupon Code
22. November 2024

Get 25% off Using Our Black Friday Coupon Code BLACKFRIDAY24!
The coupon code applies to the first three months of a monthly subscription or the first payment of an annual subscription. It can be applied to new subscriptions at checkout and is valid until the 31st of December.
Small Update
04. October 2024
This is a minor update including two changes:
- The funnel and session pages can now be hidden for private and public dashboards from the general settings page.
- We've moved the list of event pages (when filtering for an event name) to the events panel.
You can find the full changelog in our documentation.
Major Update With Improvements to Funnels, Hostname Tracking, and More
26. September 2024
We're happy to announce the next major update for Pirsch!
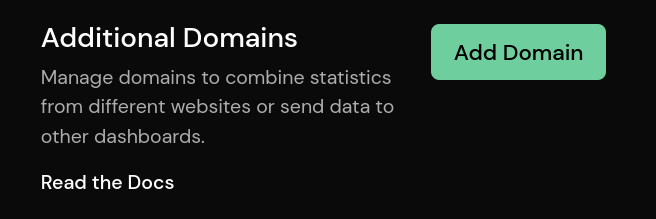
Breaking Change When Sending Data to Multiple Dashboards
Before we get into the changes and new features, let's quickly talk about the breaking change announced a month ago.
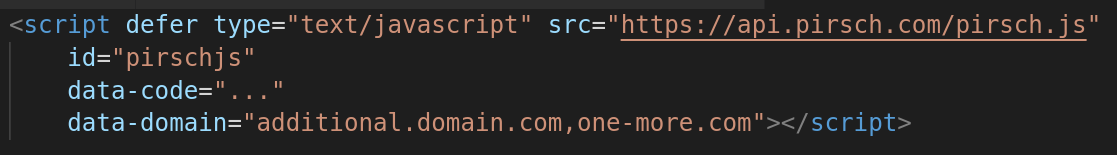
When sending data to multiple dashboards, in addition to the hostname, the identification code of the receiving dashboard must be set. This only affects scripts with the data-domain attribute. Rollup views are unaffected. The API is unaffected by this change.
As a quick example, the snippet currently has an optional data-domain attribute like this: data-domain="sub.example.com". With this update, this must be changed to data-domain="sub.example.com:CODE".
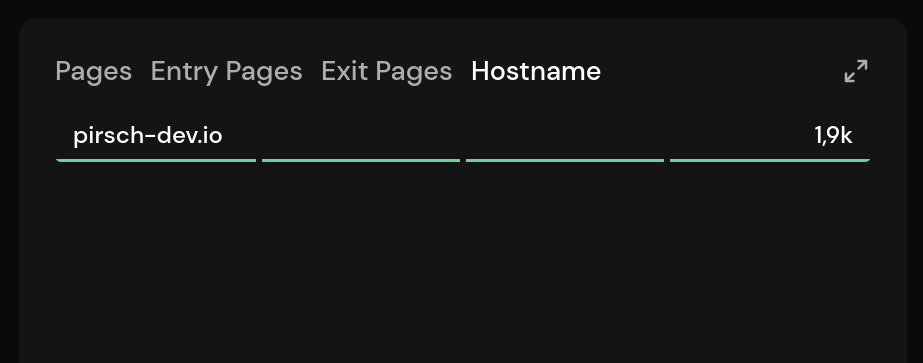
Tracking Hostnames
In the past, tracking multiple websites on a single dashboard (roll-up) required adding a path prefix if you didn't want to merge paths. This has now become much easier as we're now tracking the hostname by default. Adding a path prefix or suffix is still available through the script.
The new entry in the Pages panel will list all hostnames. You can filter for them as you're used to with other fields.
Clicking a path in the Pages panel will now also open the correct domain. It won't work for historical data though.
Visitors by Weekday and Hour
The new panel at the bottom of the dashboard shows visitors grouped by day of the week and time of day. This allows you to see when you have the most visitors on your site and know when it would be best to run a marketing campaign or publish a new blog post.
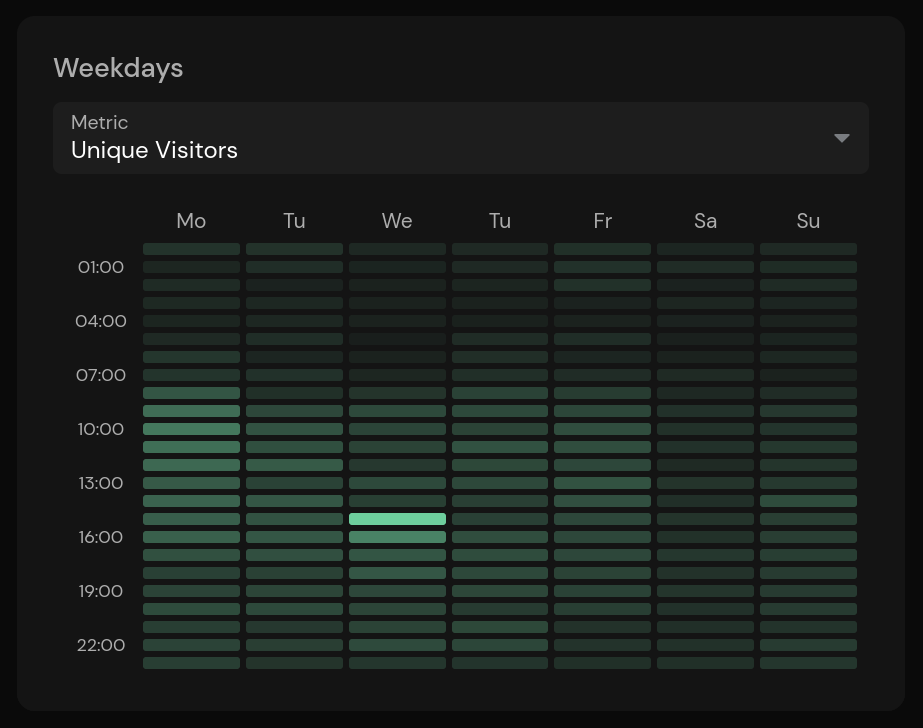
You can toggle between different metrics. Including the number of unique visitors, page views, sessions and bounces.
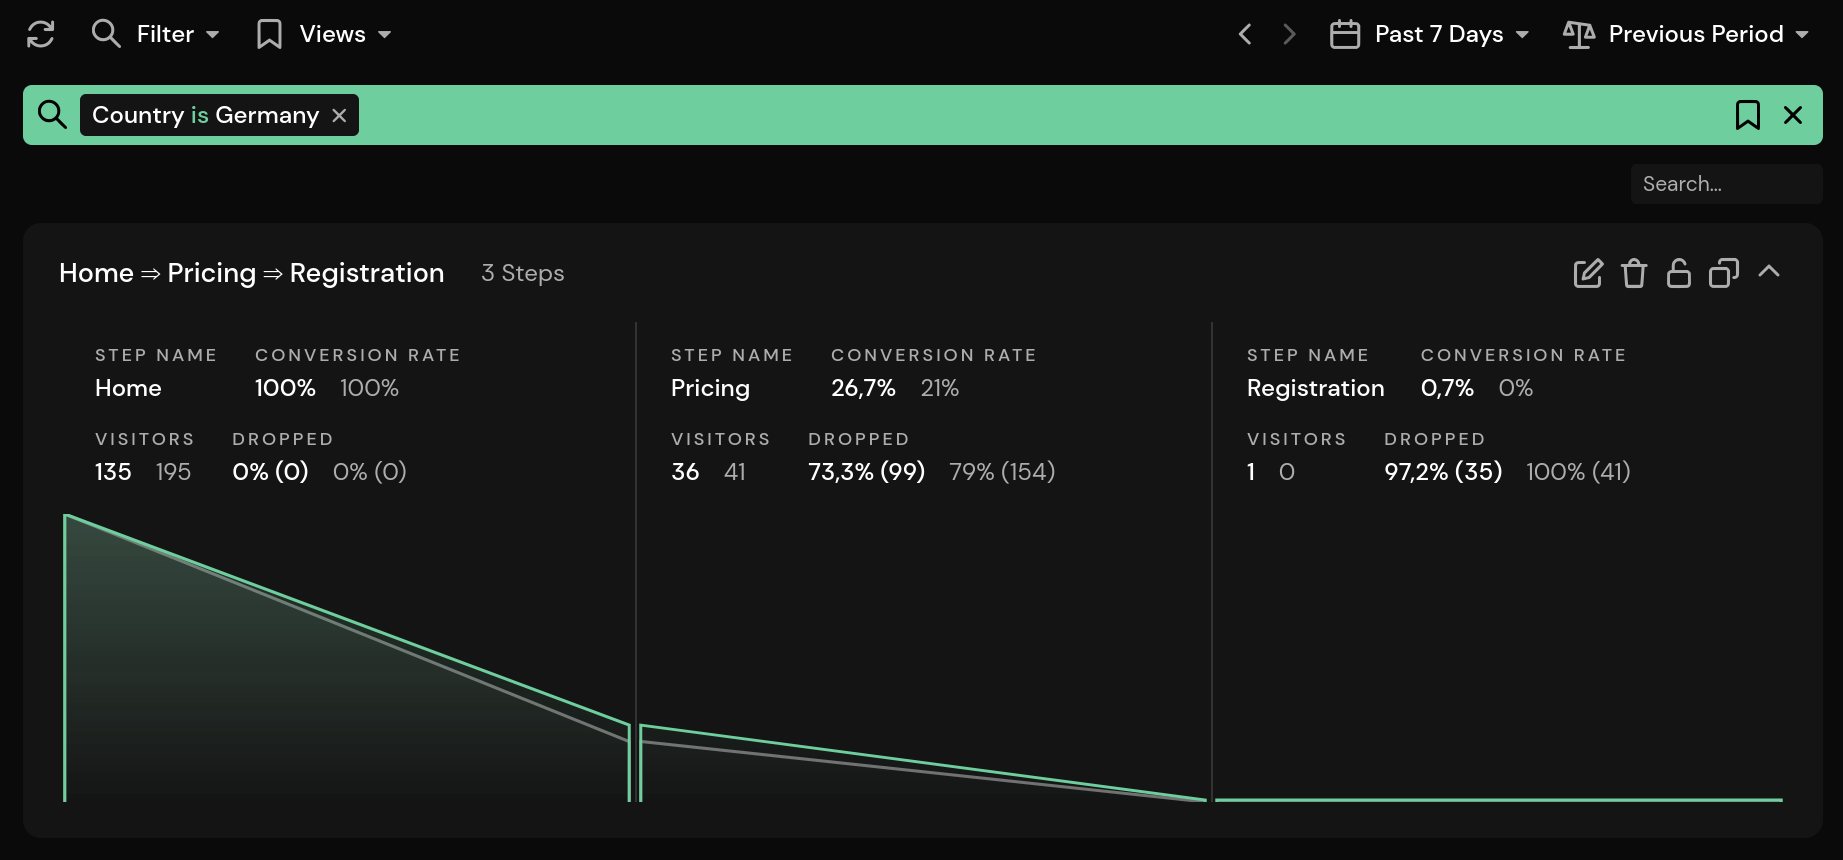
Filtering and Comparing Funnels
You now have the ability to filter funnels. The regular filter applied to the dashboard now also applies to funnels. This makes it easy to further drill down on existing funnels.
In addition, the comparison mode now also applies to funnels, showing the numbers and graph for the previous or selected previous period.
Other Improvements to the Statistics
We've made additional improvements to the statistics on your dashboard, including:
- Sorting entry and exit pages by entry and exit rate
- A new conversion rate graph for goals
- Filtering directly for a regular expression from the filter selection
Improved Access Links and Reports
Access links can now be configured to have an expiration date. Email reports take advantage of this by now allowing you to share the dashboard via a link.
You can find the full changelog in our documentation.
API Rate Limiting
02. September 2024
With today's update, we're introducing rate limiting for the API.
If you're an API user, don't worry, as this only affects security-related endpoints and general configuration. Refreshing an oAuth access token, data ingestion, and reading statistics hasn't been changed and currently doesn't have a limit. If we add a limit for these endpoints in the future, we'll announce it in advance.
To learn more about rate limiting, please see our API Guide.
New IP Addresses for Custom Domains
28. August 2024
If you use custom domains, please update the IP addresses! While upgrading our load balancer, we accidentally changed them.
We're really sorry that this happened and should have taken more care. You can find the new IP addresses on the settings page or on our documentation or down below.
A: 23.88.33.242
A: 49.13.203.20
AAAA: 2a01:4f8:c013:31a6::1
AAAA 2a01:4f8:1c1e:5420::1
Breaking Change When Sending Data to Multiple Dashboards
27. August 2024
Attention! We're going to make a breaking change in version 2.8 that affects additional domains!
Sending data to multiple dashboards will require the identification code of the receiving dashboard to be set in addition to the hostname. This only affects scripts with the data-domain attribute. Rollup views are not affected. The API is not affected by this change.
As a quick example, right now the snippet has an optional data-domain attribute like this: data-domain="sub.example.com". With the next major update, this will need to be changed to data-domain="sub.example.com:CODE".
Please see our documentation to learn more. You can make the change today, both configurations will work for now. The next major update won't be released until the end of September.
New Google Analytics 4 Import
16. August 2024
We're happy to announce that you can now import your Google Analytics 4 data!

Google Analytics 4 Import
As before, you will need to connect to your Google account on the settings page and select the time period you want to import. Data will only be imported up to the time the Pirsch Dashboard was created.
There is one new limitation due to the new GA4 API: exit pages are not supported. We'll add them as soon as Google adds the missing field to their API!
Imported Statistics
Imported statistics are now stored in our analytics database, greatly improving performance.
Existing data will be migrated. You may not be able to access your previously imported data until we've fully migrated it. Please be patient.
Other Improvements
Of course, we have fixed bugs and improved Pirsch in several places in this release, including
- Improved error messages for theme settings
- We have improved our bot filtering technology
- Various interface and usability enhancements, such as better filter parameters, closing modal windows with a mouse-down rather than a mouse-click, and more
- Fixed the relative number of platform visitors when filtering
Please contact us if you find any bugs.
You can find the full changelog in our documentation.
Multi-Step Funnels
08. July 2024
Today we're releasing one of the most requested features: Funnels!
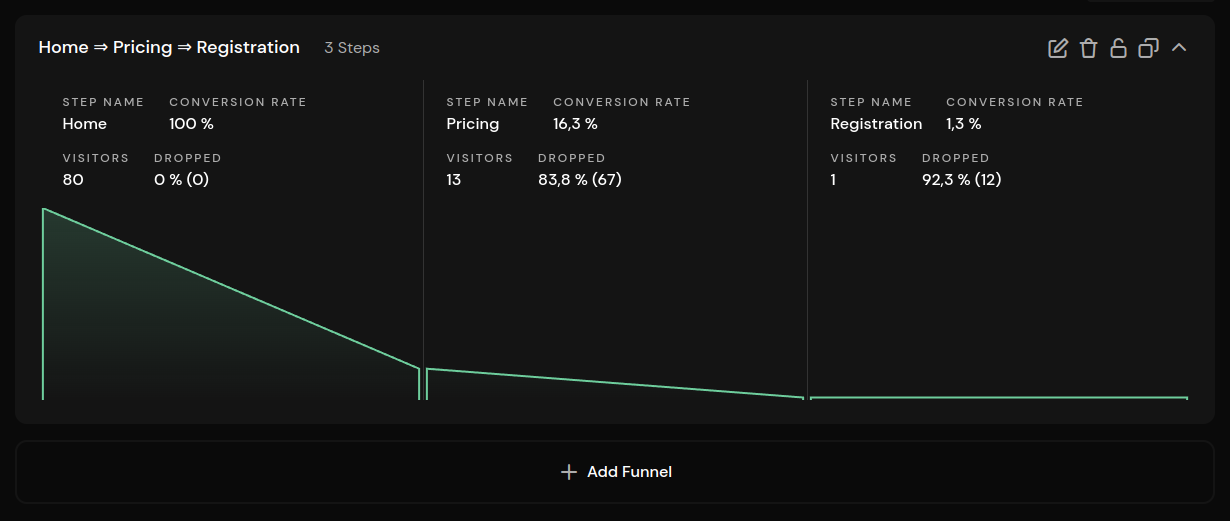
Funnels
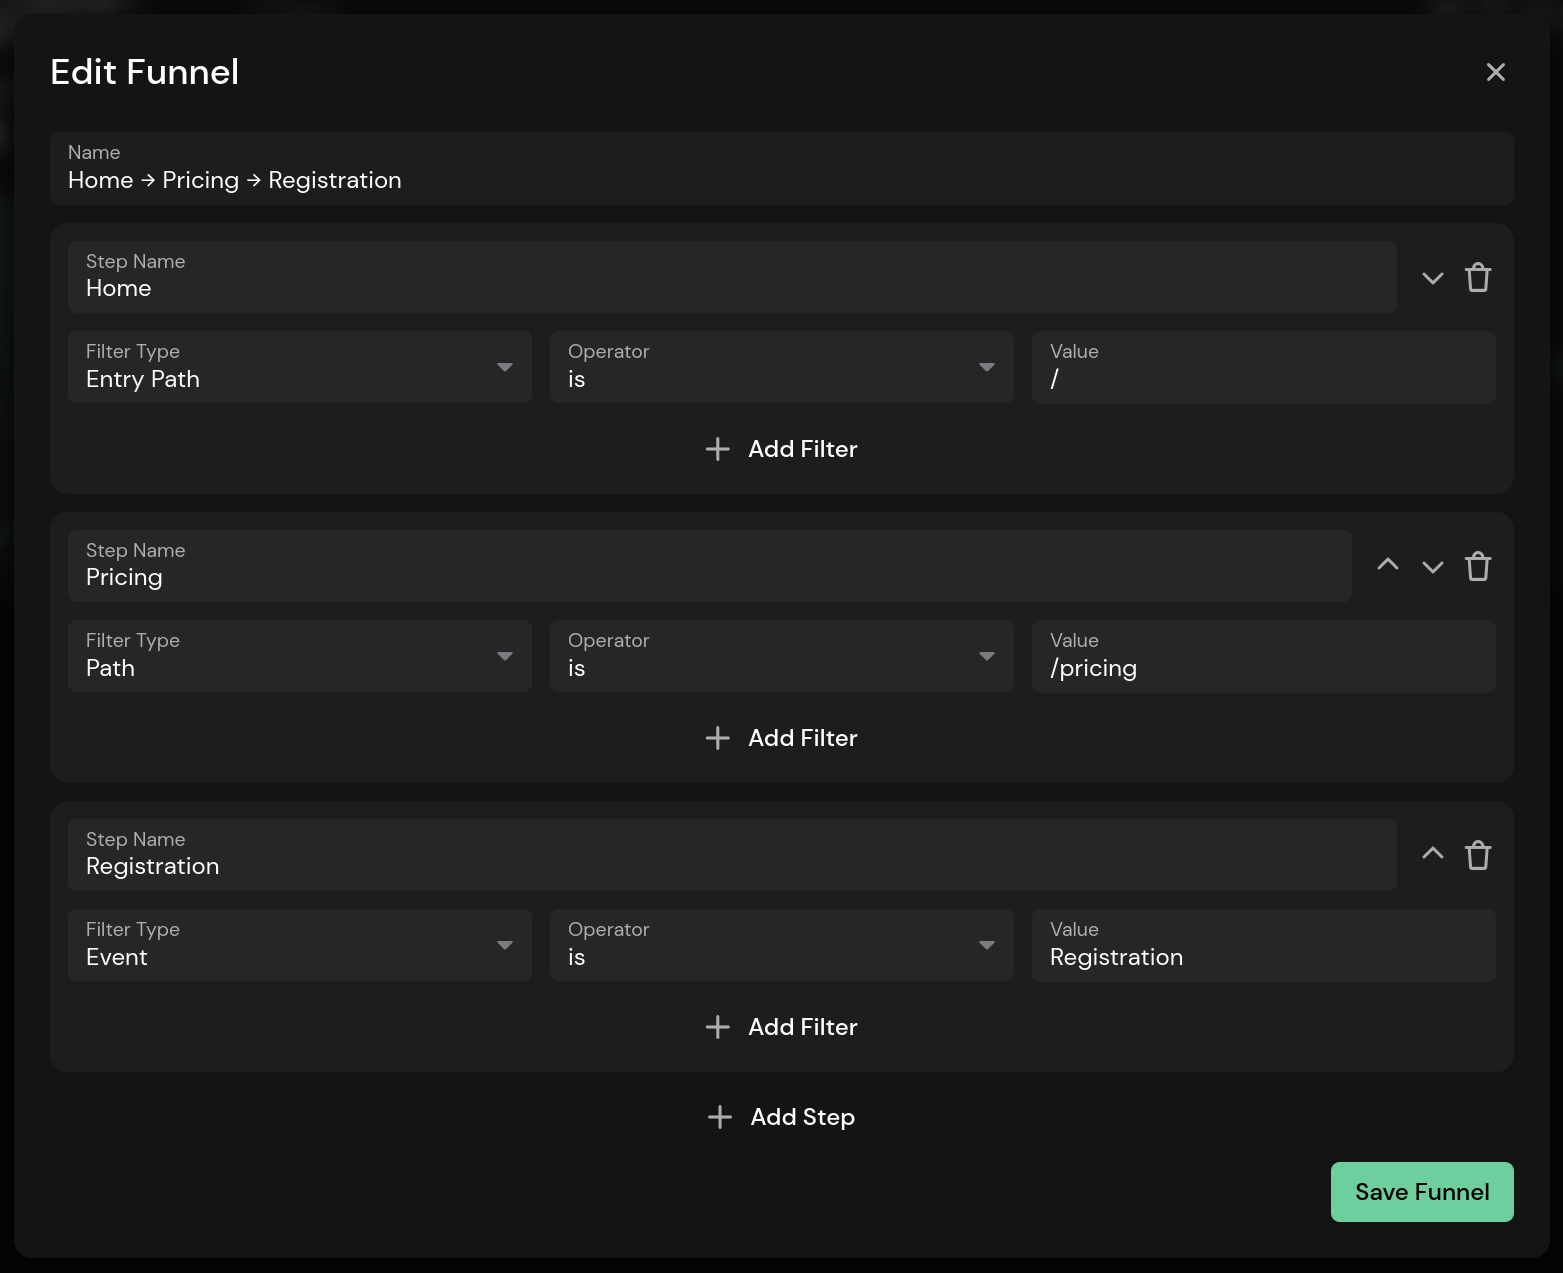
Multi-step funnels allow you to track your visitors' journey until they complete a conversion. You can define up to eight steps, each consisting of one or more filter options. These include pages, page patterns, custom events, tags, and all the other options you're used to in the dashboard. You'll be able to see how many visitors dropped off in each step, the conversion rate of each step, and the total conversion rate.
Here are a few examples:
- Track conversion from a specific landing page to registration
- See how well your paid advertising campaigns convert visitors to purchase specific products
- Analyze the completion of a tutorial or multi-page flow
Steps do not have to be in perfect order. You can skip steps in between and filter only for relevant data. For example, if someone visits the home page, the pricing page next, and then triggers a custom event to complete the conversion, you can start the funnel at the home page and add the custom event as the second step. The pricing page is irrelevant in this example and won't affect the funnel.
Funnels are a Pirsch Plus feature. To learn more about funnels, see the documentation.
Other Changes
As always, we have included some minor changes and bug fixes in this update. Here are two notable ones:
- The dropdown to add a new dashboard now allows you to create a funnel and organization directly
- We've added a language switch for public and custom dashboards
- You can configure the default language of the dashboard using a query parameter for embedding
You can find the full changelog in our documentation.
New Permissions for Admins
02. July 2024
This update includes mostly bug fixes and an important change to the admin privileges.
Dashboard and organization administrators now have access to all settings. This includes any destructive actions such as deleting data or the entire dashboard. We did this because organization owners often had to step in to make important changes instead of allowing their team members to make those changes. Since only trusted people should have access to your dashboards and organizations, we simplified it to give them full access.
One of the more significant fixes in this update relates to Pirsch Plus. Organization members were unable to make configuration changes that required a Pirsch Plus subscription. This is now fixed.
You can find the full changelog in our documentation.
New Filter and Tags in Sessions View
17. June 2024
Right after the release of version 2.5, we made some minor improvements that we are rolling out today!
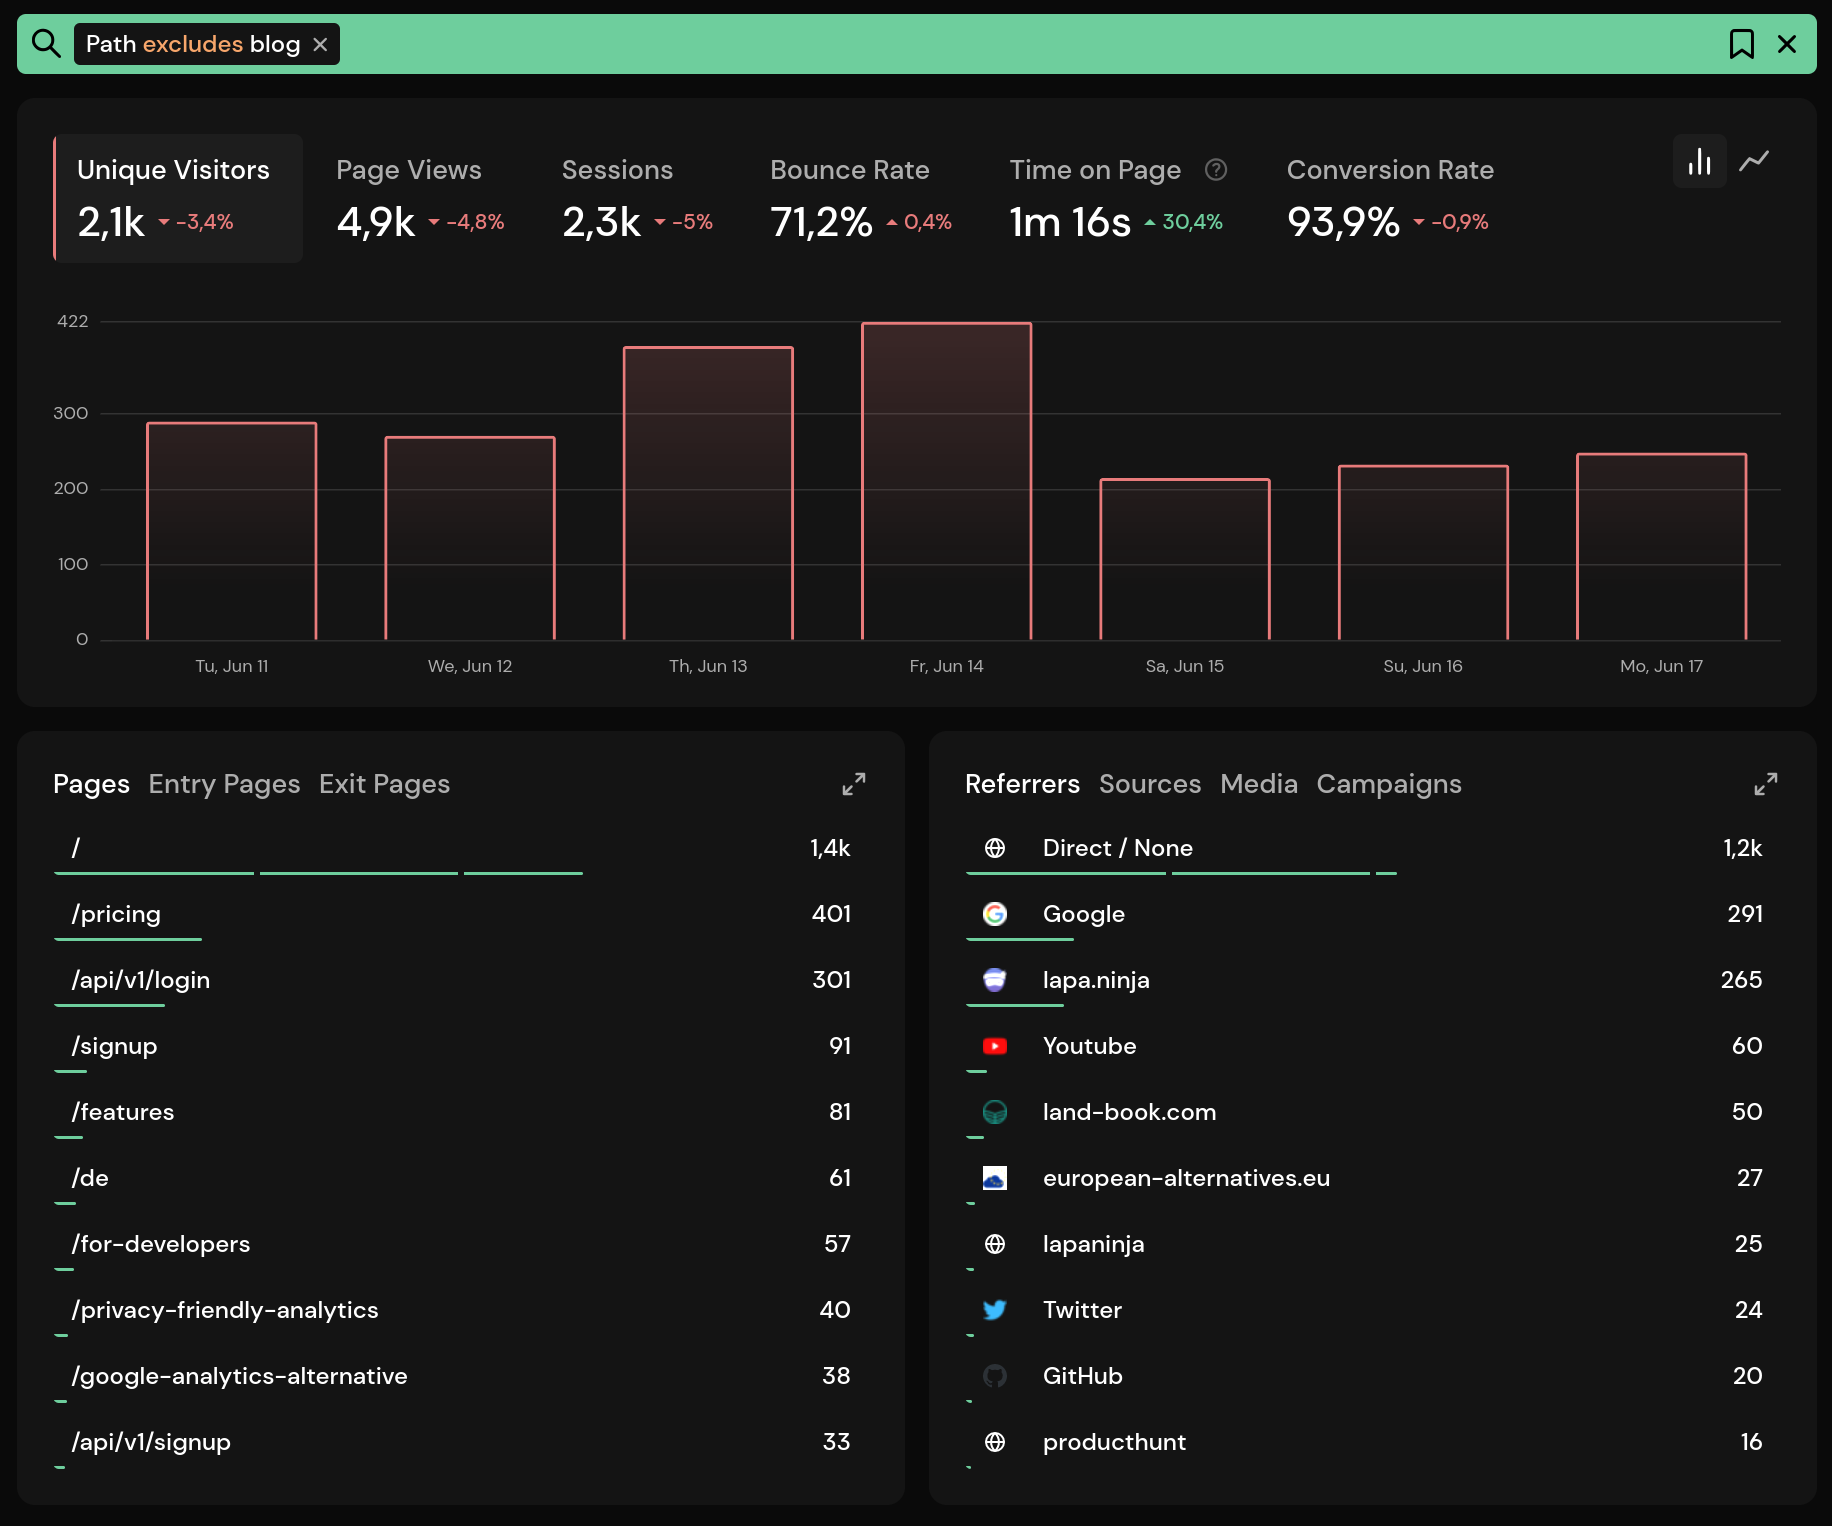
New "Excludes" Filter
We have added a new filter to exclude fields that contain a string. For example, you can now filter for all paths that do not contain the string "blog".
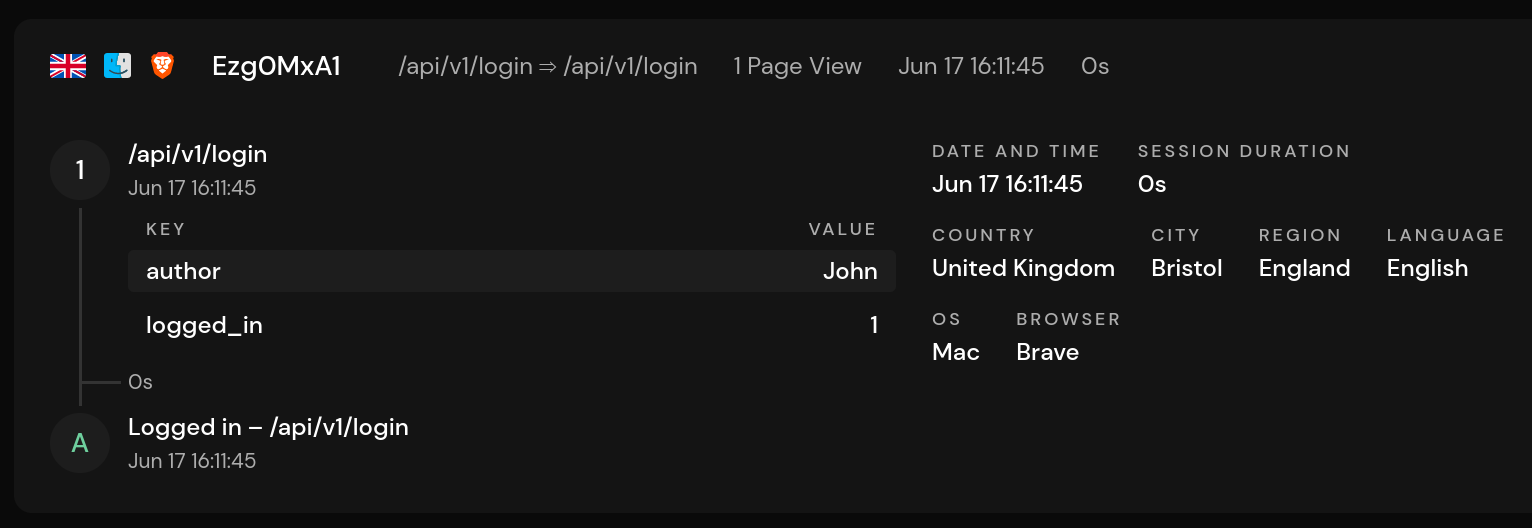
Tags in Sessions View
The Sessions page now displays tags for individual page views.
Other Changes
Of course we included a few bug fixes and other changes as well. One notable one is that you can now configure a dashboard on creation using the API.
You can find the full changelog in our documentation.
Introducing Pirsch 2.5
15. June 2024
Today we introduce Pirsch version 2.5 with a fully translated dashboard and other changes!
Translated Dashboard
The dashboard is fully translated into German, Spanish, French, Dutch, Italian, Portuguese and Japanese! Your browser language will be used by default, but you can change the language in your account settings.
Other Changes
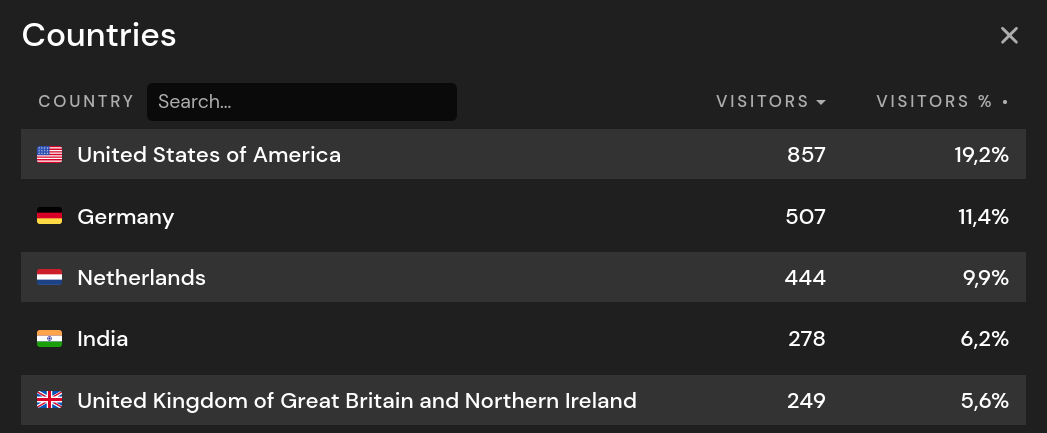
- You can now filter the dashboard by clicking on a country on the map.
- The time period can now be set to the last hour of today (keyboard shortcut U).
- API errors now have a context element to return details instead of embedding them in the message.
You can find the full changelog in our documentation.
Shopify Integration Guide
04. June 2024
It now has become a lot easier to integrate Pirsch into Shopify!
Since we've had a lot of people asking how to integrate Pirsch with Shopify, we've created a setup guide on our documentation. It covers general setup steps, custom event tracking, and form and revenue tracking.
For a future plugin, we have some customers working on a solution. We'll let you know when it's available.
Introducing Pirsch 2.4
21. May 2024
Today we introduce Pirsch version 2.4 with some long-awaited features!
Regions
We now track regions in addition to a visitor's country and city. This is also available for sessions and you can filter on it.
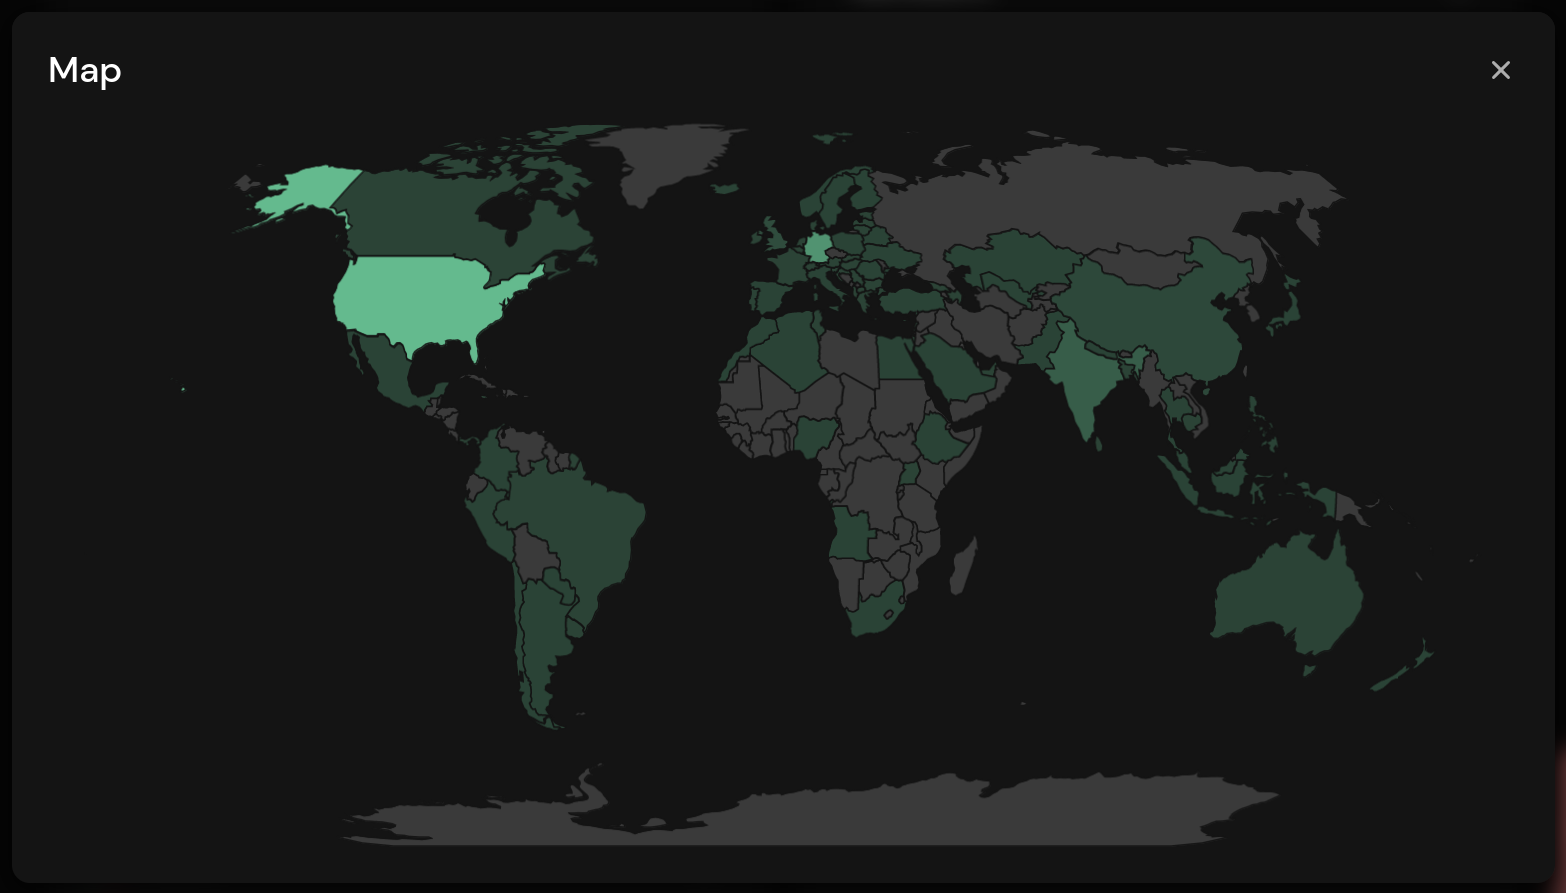
Maps
Countries and live visitors can now be viewed on a map!
Simply click the active visitors at the top or the map icon in the countries panel. The map will update if you change the filter period using shortcuts.
Changes to Custom Domains
Custom domains now require DNS confirmation to ensure you're the owner of a domain before we query an SSL certificate for it. Confirming a custom domain is done by setting a TXT record and waiting a few minutes for it to propagate. When saving the hostname, the record will be looked up to confirm that you're the owner. We'll now also check that the hostname is not in use.
The configuration and instructions can be found on the settings page or in our docs.
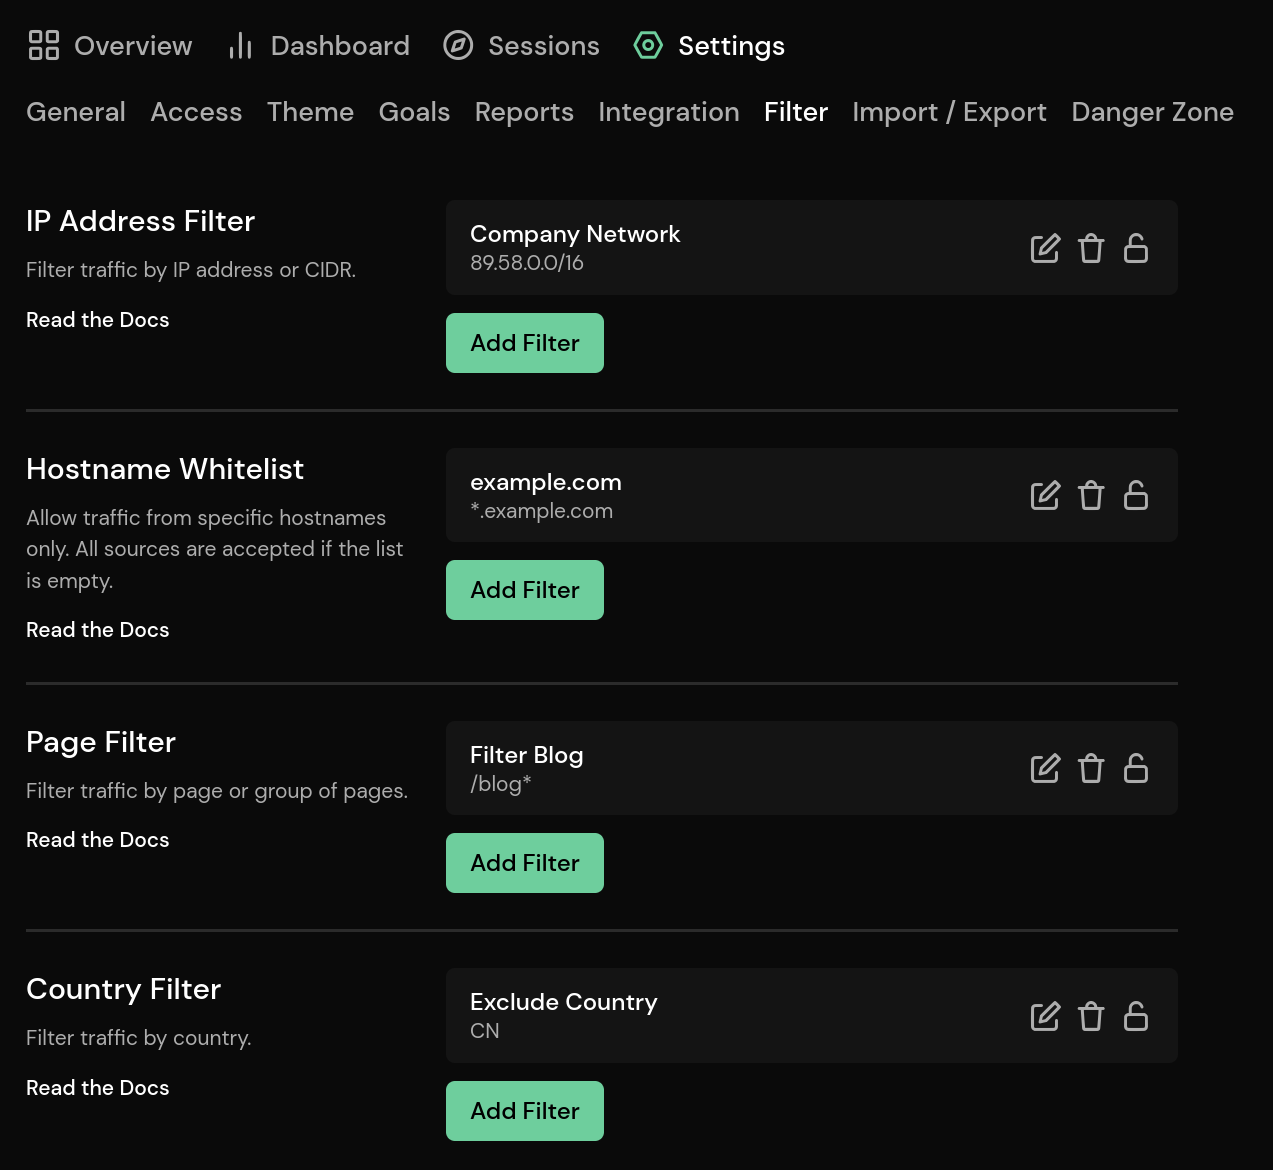
Traffic Filter
It's now possible to filter traffic based on IP address, CIDR, hostname, country and path. This makes it easy to exclude your own traffic as well as unwanted traffic. Filters can be added in the settings page.
Please note that it takes a few minutes for filter changes to take effect.
Joining Organizations based on Email Address
You can now configure domains that will be used to automatically add members to organizations. After account confirmation, any user with a specific host name in their email address is automatically added to your organization. For example, if you configure example.com as the domain, any user with an @example.com email address will be added.

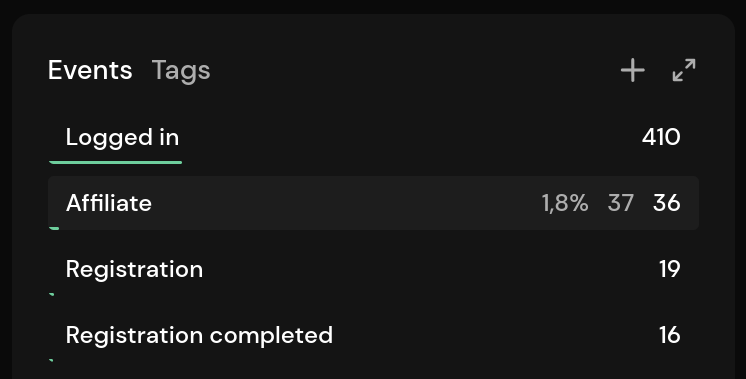
Number of Events in Panel
This has been asked for quite often. By default, we show the unique visitor count everywhere in the panels. For the events panel, we now also show the number of events on hover.
New Theme Capabilities
Themes can now be configured to hide the copyright and the light/dark mode switch. We have also fixed some issues with the current theme configuration.
You can find the full changelog in our documentation.
Plausible Analytics Import
13. May 2024
You can now import your Plausible Analytics statistics into Pirsch!
We've added a new section to the Import / Export Settings page. Simply create a zip export of all of your Plausible statistics from their settings page and upload it.
You can find the full changelog in our documentation.
Y-Axis Improvement
29. April 2024
This update introduces a slight change to the y-axis of the graphs. Instead of leaving some space at the top, we're now scaling the graph to the maximum value.
This mostly affects graphs that show relative numbers (percentages), which can be really tiny if you have a low conversion rate. Here is an example.
Before
After
You can find the full changelog in our documentation, including bug fixes and other minor changes since our last big update.
Introducing Pirsch 2.3
11. April 2024
Version 2.3 is another milestone that improves Pirsch in many ways! Let's take a look at the changes and new features.
Viewing Individual Sessions
You're now able to view sessions individually. We've slightly changed the design of the top menu to make more space for the new Sessions page.
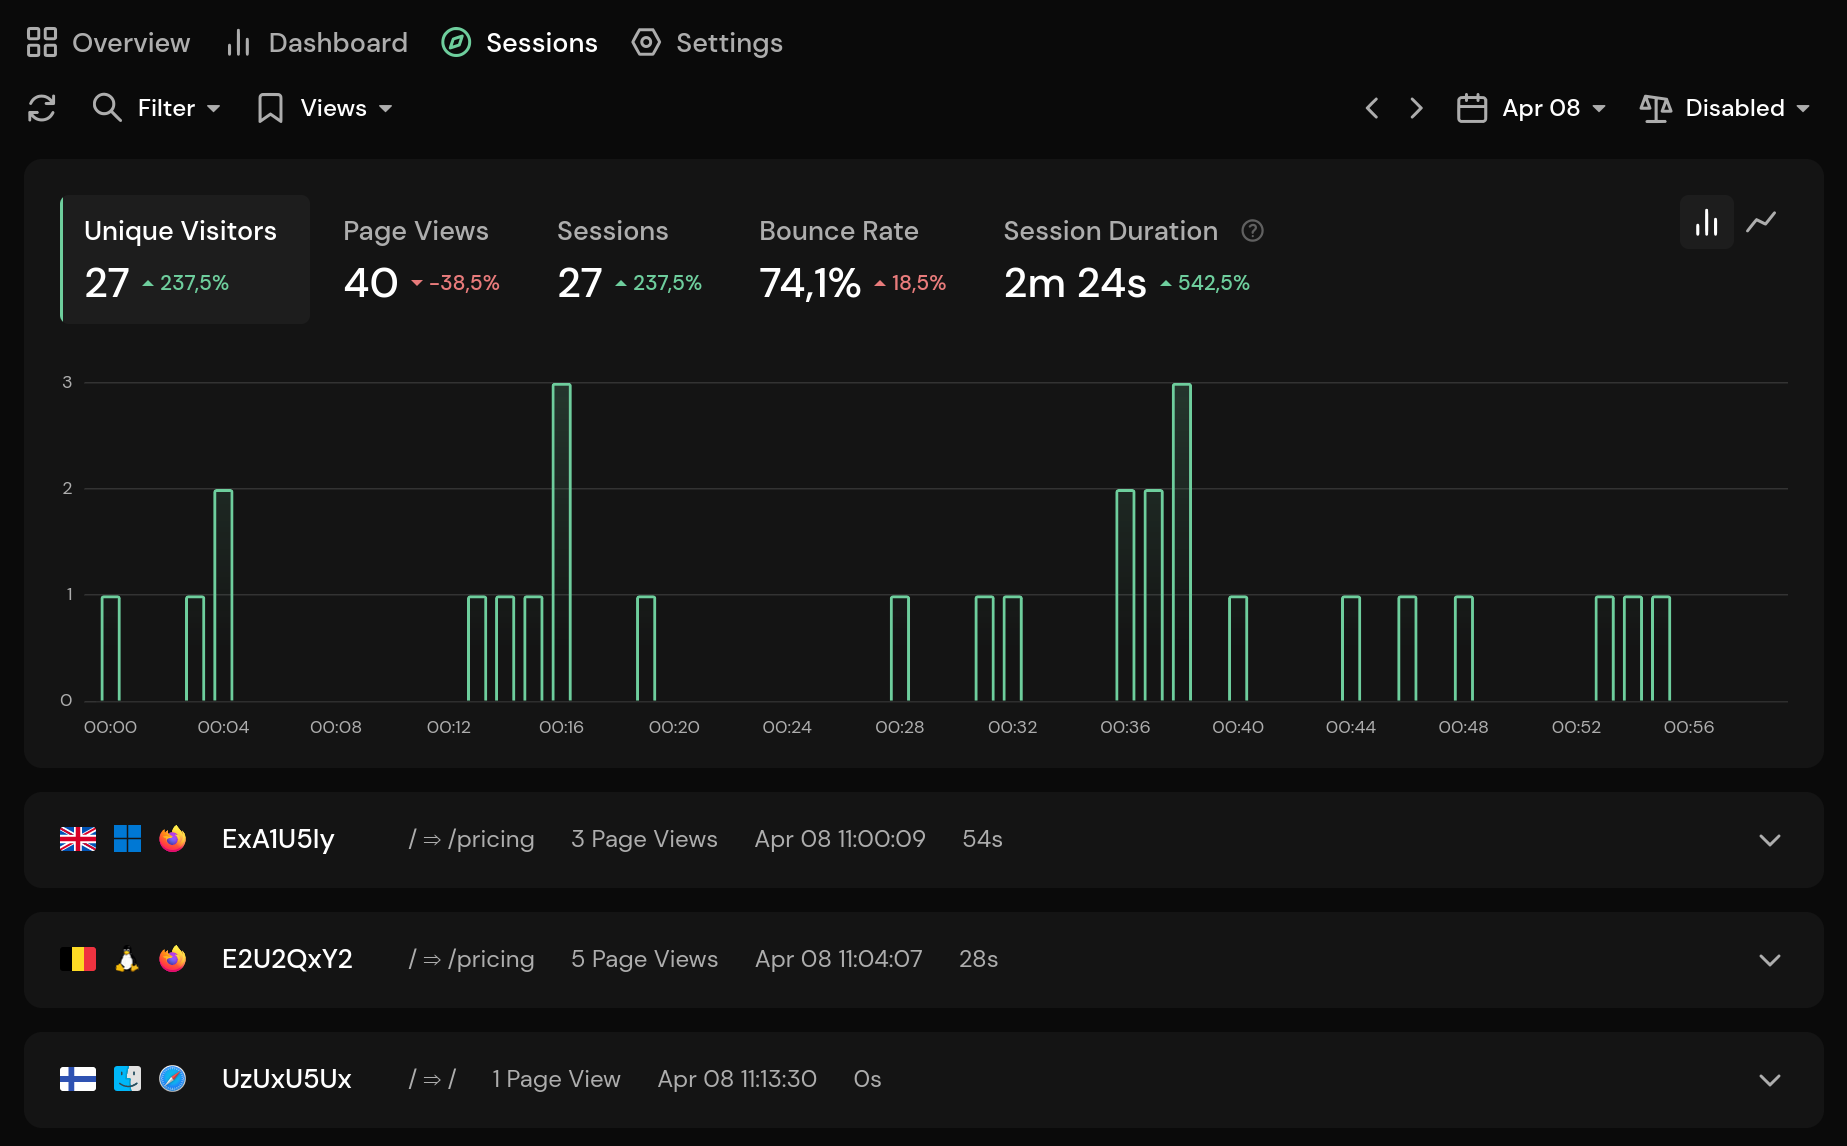
The results must be broken down until you have 200 sessions or less in the result set. Filters can be applied as you're used to on the main dashboard. In addition, we now allow you to group results by minute, so you can click on an hour of a day for more granularity.
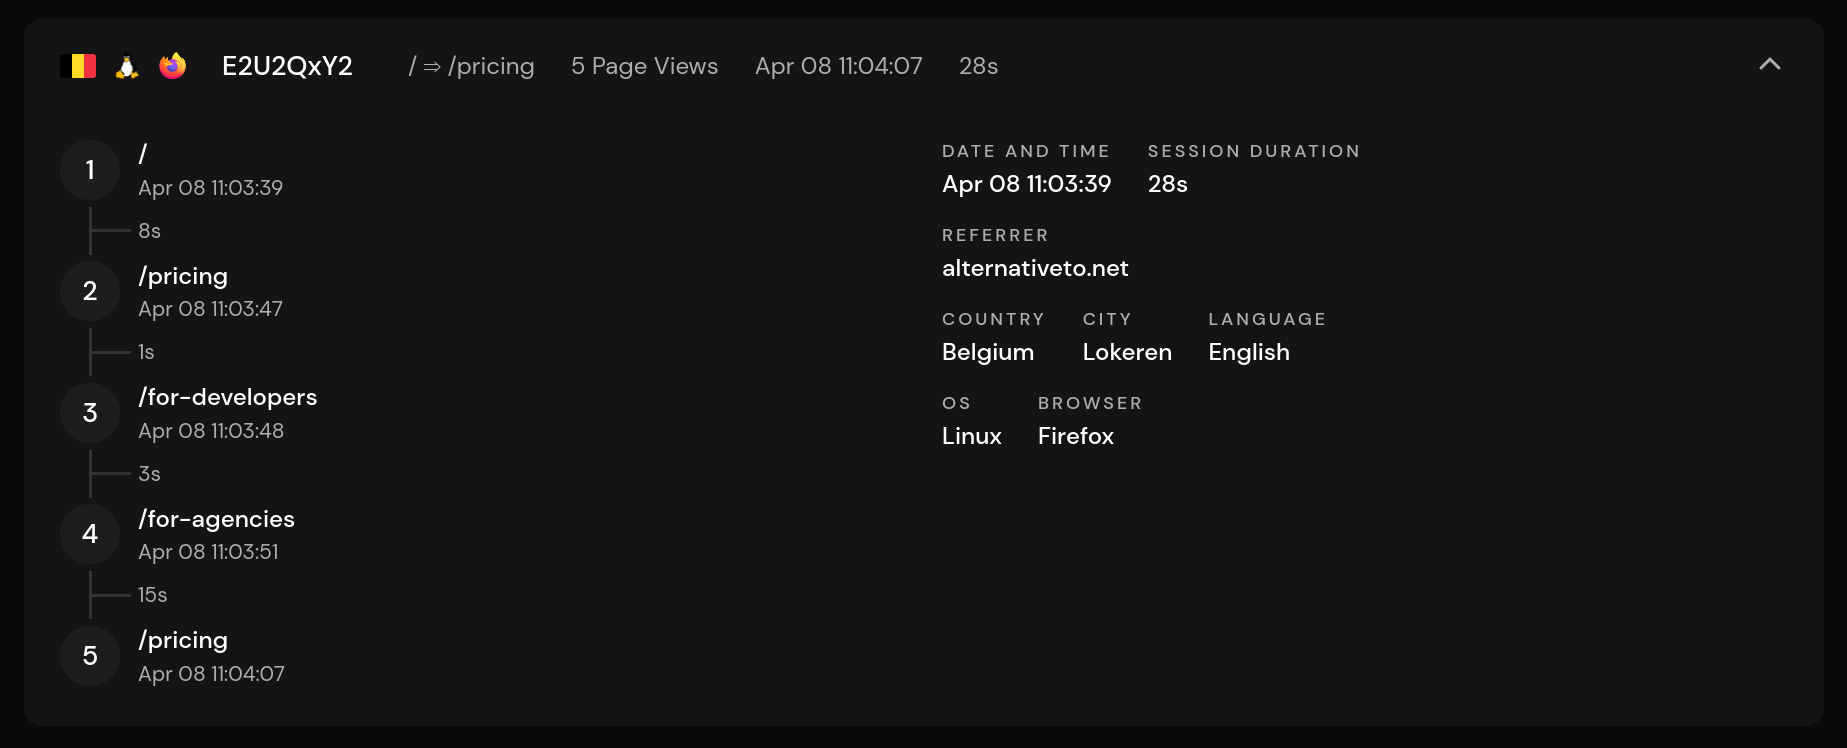
Clicking on a session in the list will show more details and all page views and events in chronological order. This can be useful to get a better understanding of what visitors are doing on your site. For example, you can filter for a custom event called "purchase" to see if there are any problems with the checkout flow of your e-commerce store.
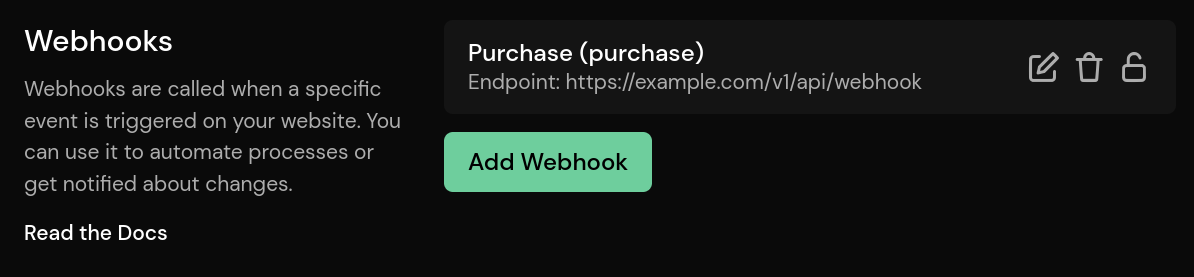
Webhooks
Pirsch now supports webhooks that can be triggered by custom events. A webhook allows you to receive the event data on a user-defined HTTPS endpoint. They are useful to automate tasks, receive updates, for example if a purchase is made or a new user signs up to your product, or to be notified when an error occurs.
Webhooks are a Pirsch Plus feature and can be configured on the Integration settings page. You simply need to chose a description and enter the event name and the endpoint.
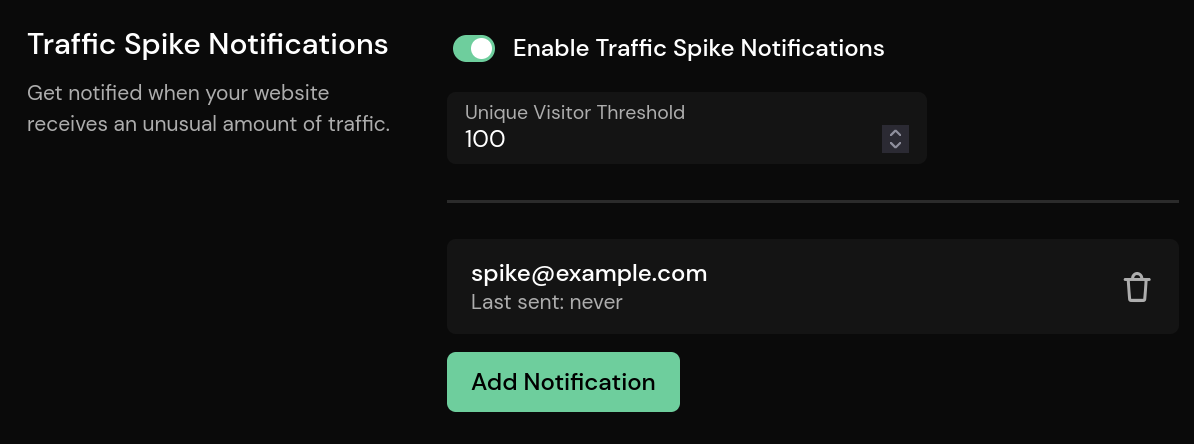
Traffic Spike Notifications and Alerts
Until now, you would have needed to constantly check your Pirsch dashboard to catch a traffic spike on your website. This has become a lot easier, as you can now configure traffic spike notifications! A traffic spike notification is sent out by e-mail if the configured threshold is reached, to any receiver you like. They are configured on the Reports settings page.
Another common issue was that changes to your website (like installing a Wordpress update or similar) might broke the Pirsch integration, leaving a gap in your data collection until fixed. We now support traffic alerts, send out if your site didn't receive any traffic for a couple of days. The threshold can again be configured on the Reports settings page.
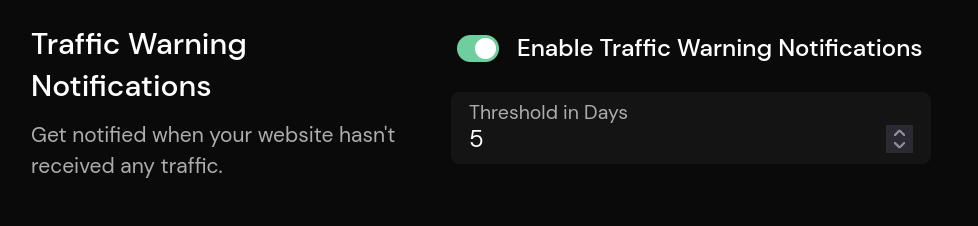
The warning is sent by e-mail to all administrators.
New Consolidated Script
The JavaScript snippet integration got a bit confusing as we kept adding scripts with new functionality. We now decided to keep it simple and consolidate all scripts into one. Of course, the old scripts are still available and will keep working. However, the new pa.js works exactly as pirsch-extended.js, fully replacing all other scripts. The size is still less than 4 kB compressed.
If you'd like to make the switch, please remove all existing script snippets from your website and replace it with the new pa.js snippet from the Integration settings page. Any configuration can be applied as before by adding attributes on the src HTML tag.
Other Changes
Here are a few other changes worth mentioning.
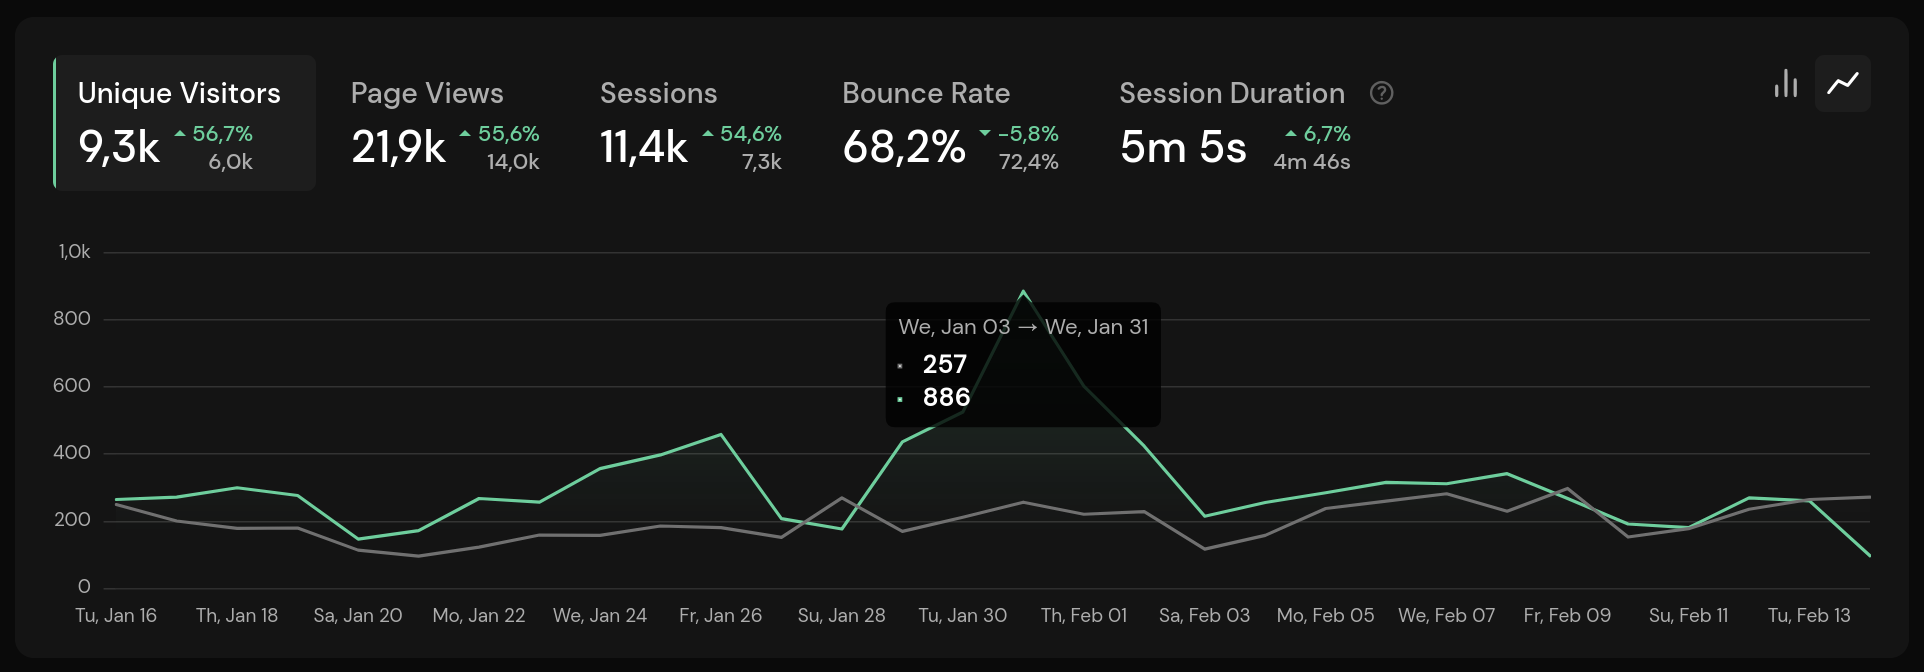
The dashboard now shows a graph for the number of unique visitors over the past week. The data is cached as before.
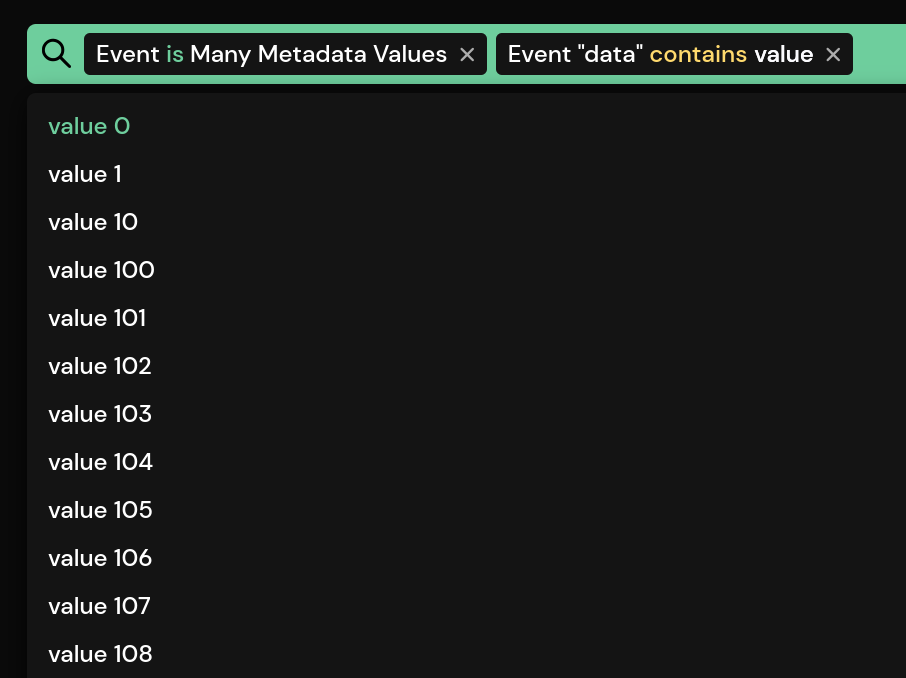
You can now apply the contains filter to event meta values, allowing you to filter long lists of metadata.
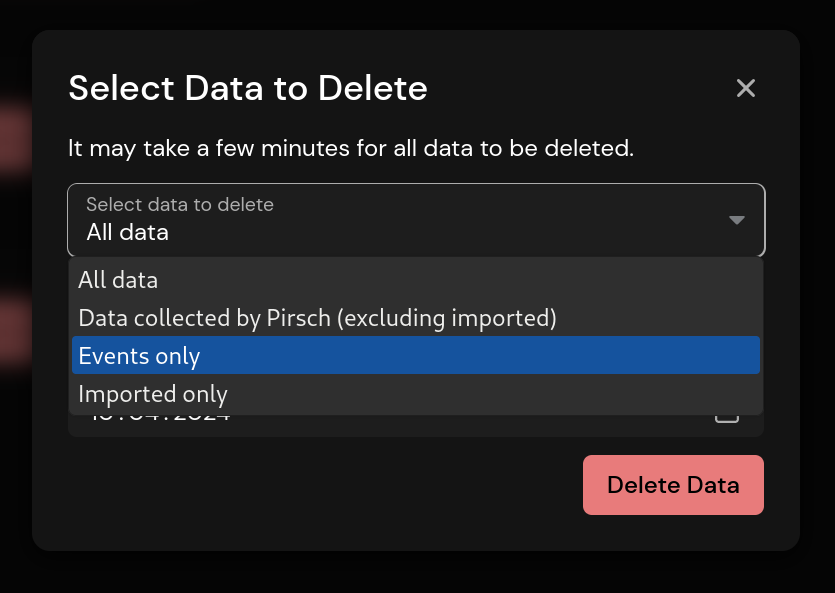
It's now possible to delete only events. Previously it was only possible to delete all statistics for a period.
Conclusion
We hope you'll find the new features useful! Please report any bugs or issues to us. You can also leave feedback on our public support forum.
As always, you can find the full changelog in our documentation, including bug fixes and other minor changes.
Introducing Pirsch 2.2
14. February 2024
Pirsch 2.2 is the first major update in 2024, bringing new features and improvements. Let's get right to it!
Comparison View
We have added a comparison view that allows you to compare statistics with the previous period, year over year, or a custom date range.
By default, the comparison view is set to match the day of the week. For example, filtering for a single day will compare that day to the day of the previous week. If you deselect it, it will be compared to yesterday. The graph selection shows the growth to the selected previous period and the total number of visitors, page views, etc.
Learn more in our documentation.
Tag-based Segmentation and A/B Testing
You can now attach tags page views to segment your audience and users. This can also be used for A/B testing. Attaching tags is as simple as adding a few attributes to the JavaScript snippet or sending them through the API using the server-side integration.
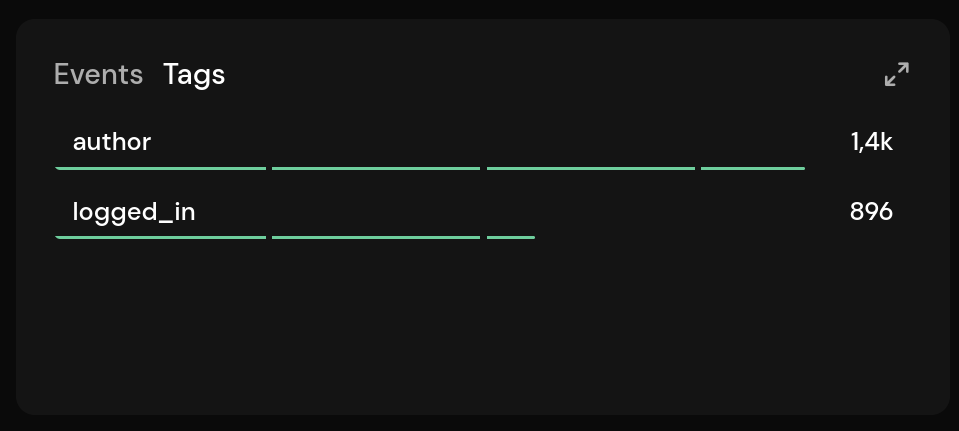
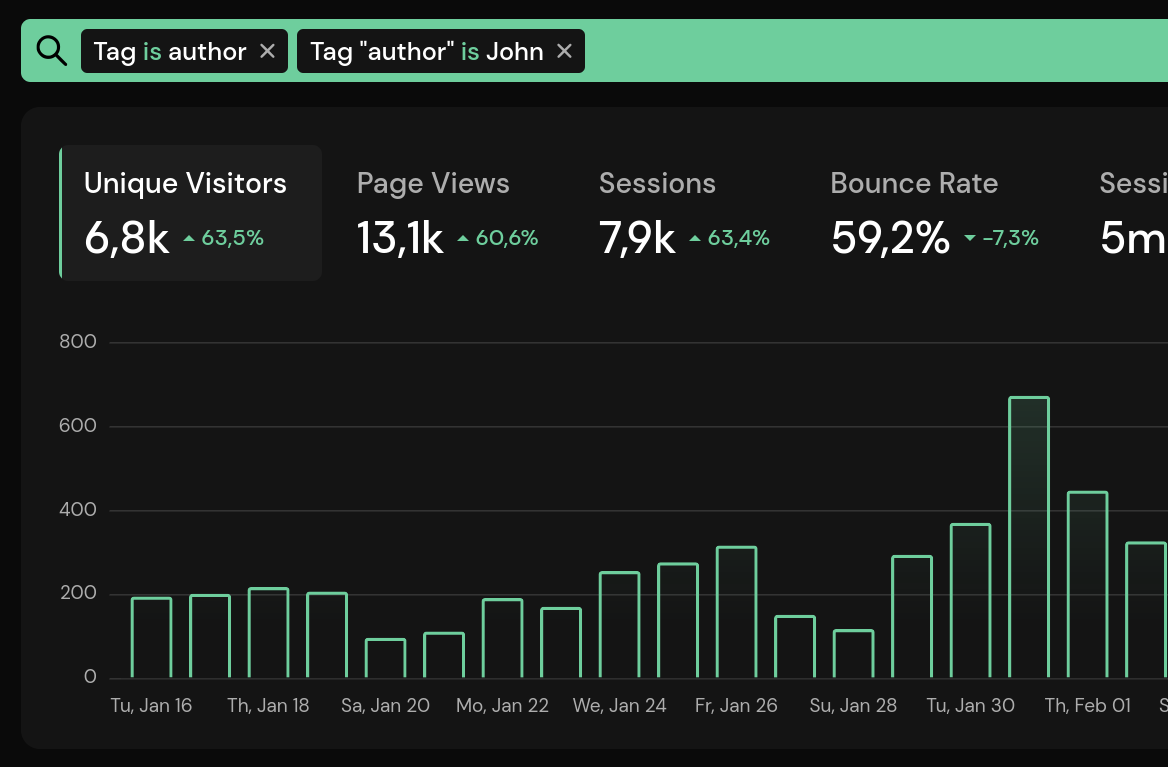
Filtering for tags works very similarly to event metadata filters. You can filter for a tag key or a tag key-value pair.
You can attach up to 20 tags to a page view, with a limit of 50 characters for keys and values. Tags are a feature of Pirsch Plus.
Learn more in our documentation.
Fathom Analytics Import
Many of our customers have switched from Fathom Analytics to Pirsch. We've now made this much easier by allowing you to import your historical Fathom Analytics data into Pirsch. The data can be imported as a zip file from the Import/Export Settings page.
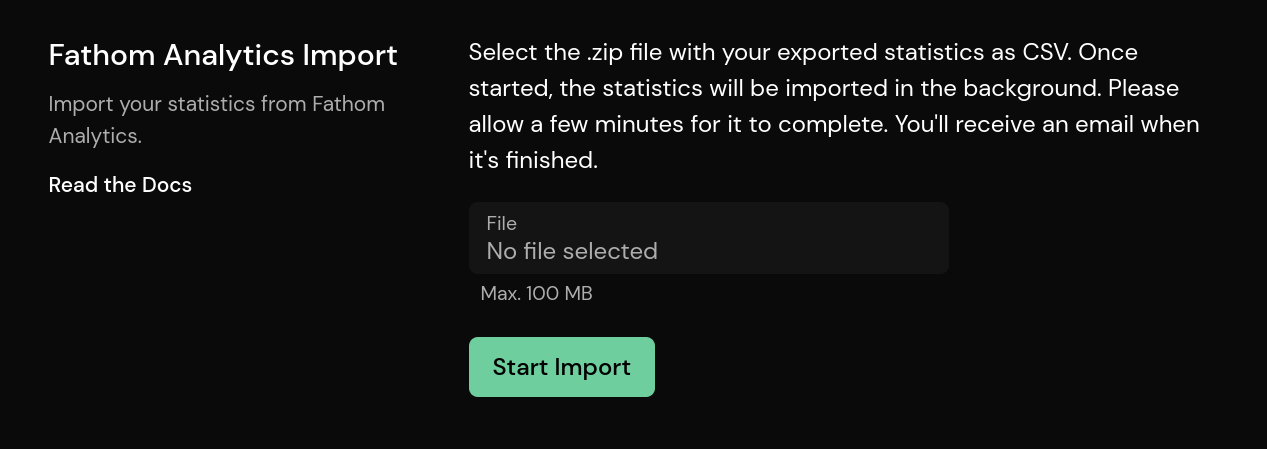
Learn more in our documentation.
Set A Path/Title Prefix and Suffix
We have recently added a path prefix to allow data to be separated on rollup views. The prefix is added to the path of a page view so that you can distinguish your sites on a rollup view. We have now added a suffix for the same purpose, and you can now also add a prefix or suffix to the page title.
Learn more in our documentation.
New Event Metadata Limits
Custom events now have a limit on how many metadata key-value pairs you can attach and how long they can be. The limit is 20 key-value pairs per event. The key is limited to 100 characters. The value is limited to 2000 characters.
We've made sure that no one is exceeding these limits right now. So you don't have to worry about anything breaking. However, if the limit is reached, you'll now get an error message.
Other Minor Changes
Other minor changes in this release include:
- Conversion goals are now sorted alphabetically when the number of unique visitors is the same
- The domain ID is now displayed on the settings page, so you can easily copy it when working with the API
- You can now set a display name for dashboards, which will replace the domain name in the dashboard selection if set
- Bug fixes and other minor improvements
Conclusion
We hope you enjoy this release! Please let us know if you find anything that doesn't work as intended. You can also use the new public support forum for general questions and feedback.
In the coming days, we'll be updating the SDKs and providing more examples of how to use the new features. To start with, we'll show how to use tags for easy A/B testing, as this has been a popular request.
Pirsch Analytics 2.0 Is Live on Product Hunt
30. January 2024
We put so much work into Pirsch Analytics 2.0 that we want to show the world what we built and hear what people are think about it.
For those of you who would like to give us feedback, ask a question, or just say hello, now would be the perfect time. We look forward to your comments and reviews!
Visit Product Hunt
Discourse Support Forum
16. January 2024
Hi everyone! We hope you had a fantastic year 2023.
This is our first update for 2024, introducing a new Discourse support forum! The forum is intended to replace Discord in the future, so that we can all share a public and indexable knowledge base. Use it for:
- Public support requests and questions
- General questions about analytics
- Get tips and help by other users, or support them
- Share your work and showcase your website or product
You don't need to create a separate account. Simply sign in using your Pirsch account.
Please let us know if you think something is missing, such as a category. You can find links to the forum in the resources menu (top right) or on our website.
Domain Search, Pinned Dashboards, and More
19. November 2023
This is our last update before we start working on Pirsch 2.2, which will include a comparison view and segmentation (aka tagging). We've made a lot of smaller improvements, so let's get right to it.
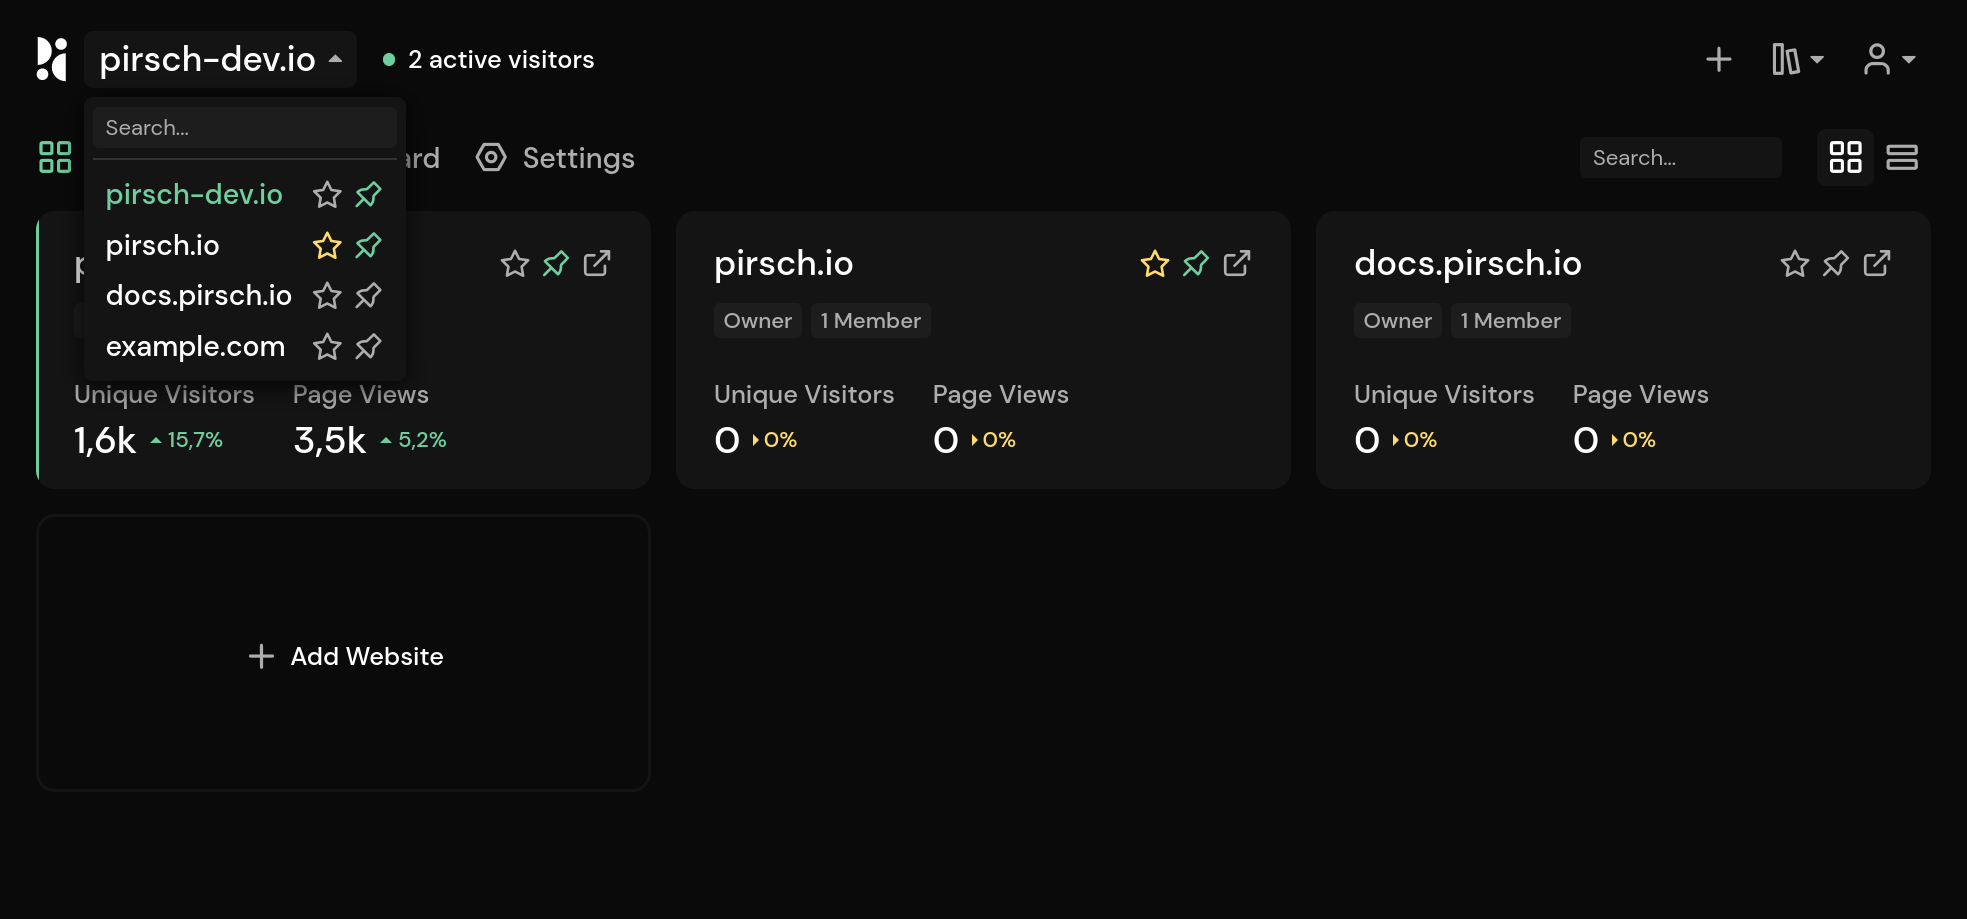
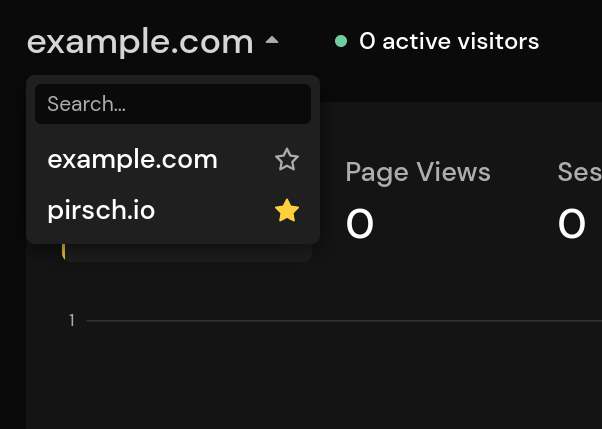
Dashboard/Organization Search and Pinned Dashboards
We've added a search field to the dashboard and organization overview in the top right corner. The search field filters the lists by hostname and organization name, respectively.
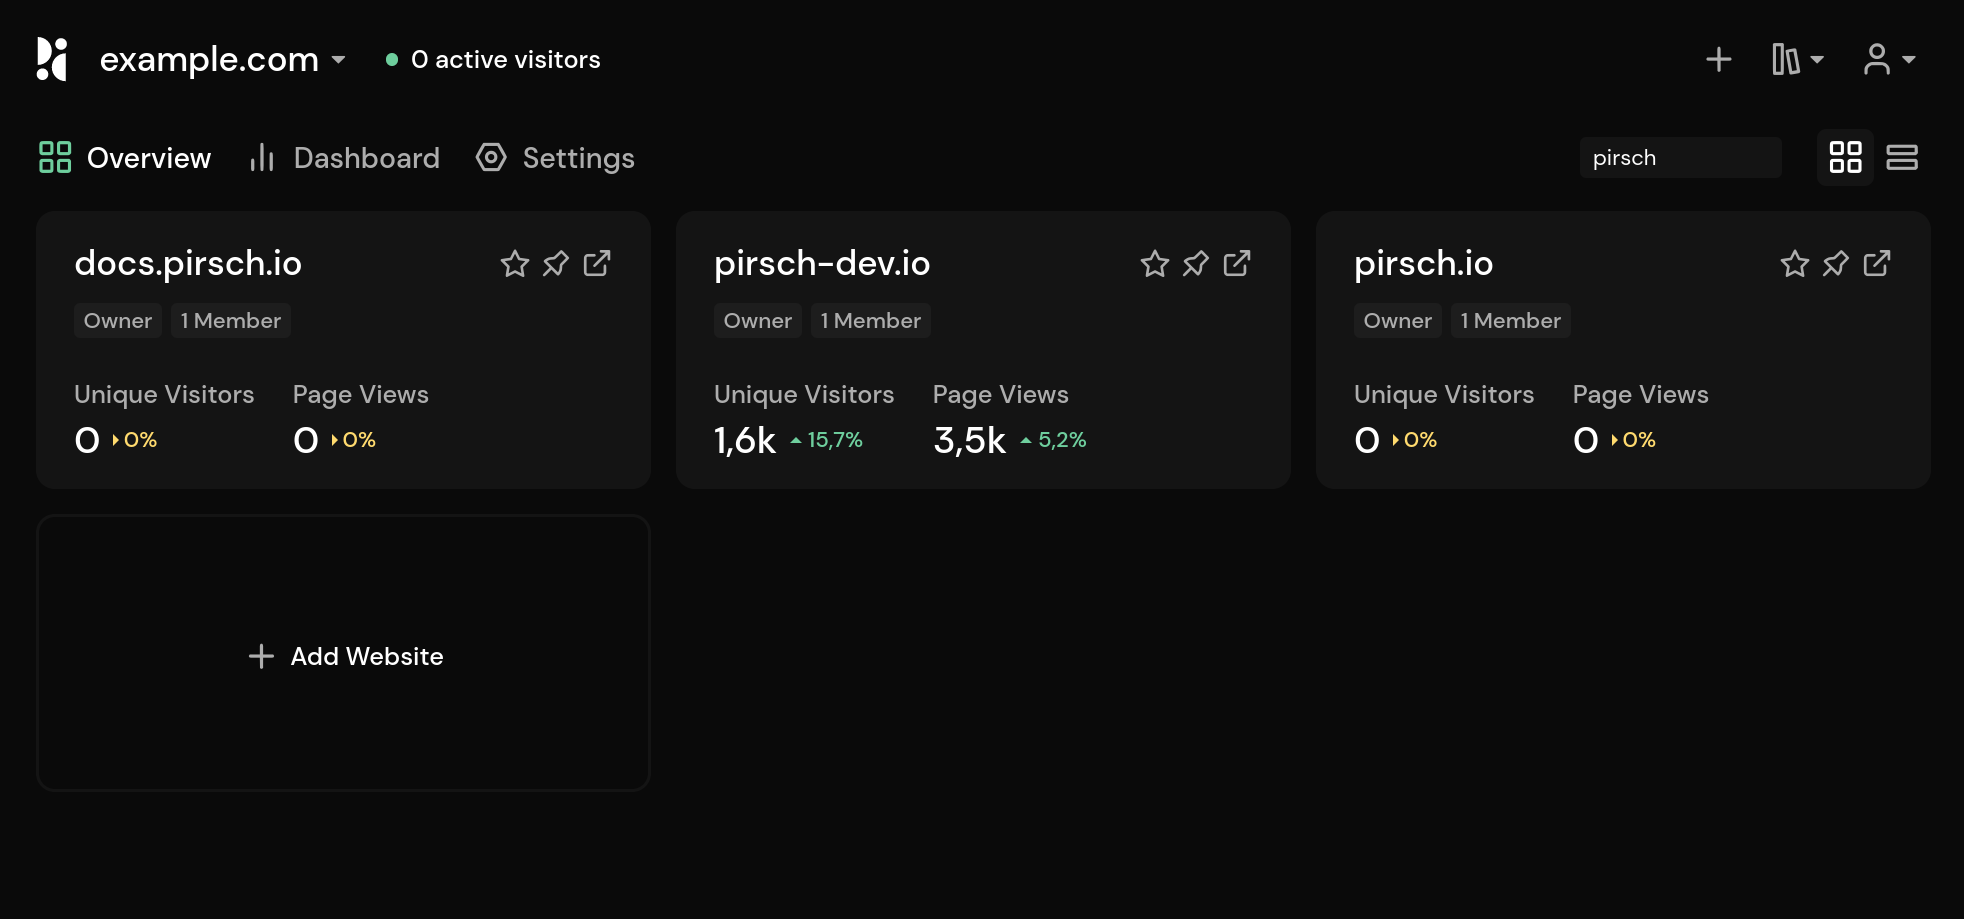
You will now be able to pin dashboards and set them as favorites directly from the dashboard overview. Pinned dashboards are always listed first, including the dashboard selection in the top left corner.
Improved Roll-up Views
Rollup views have been enhanced. First, if you're a Pirsch Plus customer using a custom domain, you can now include the data-endpoint parameter in the script to prevent ad blockers from blocking requests to pirsch.io. You can copy the modified scripts from the integration settings page or add the parameter yourself.
Secondly, there now is a data-path-prefix parameter that can be added to rewrite the request URL. Setting it will change the request path. This is useful if you're collecting the statistics for multiple websites on a single dashboard, but would still like to distinguish them. Learn more on our documentation.
Other changes include:
- Pirsch now detects the Arc web browser
- Arc and Samsung Internet now have icons
- A new scope for account clients to read usage statistics has been added
- We've added a banner if the last payment failed
As always, you can find our full changelog here.
Performance Optimizations and Sampling
28. October 2023
As you can probably see from the version number, there have been a lot of minor updates since the release of Pirsch 2.1. In this update we would like to summarize the changes that have been made since then.
- We have improved the accuracy of the combined statistics from Google Analytics and the data we collect
- Imported statistics load much faster
- Email reports can now be configured to link to a public dashboard
- The events table (details view) now displays the total number of events correctly
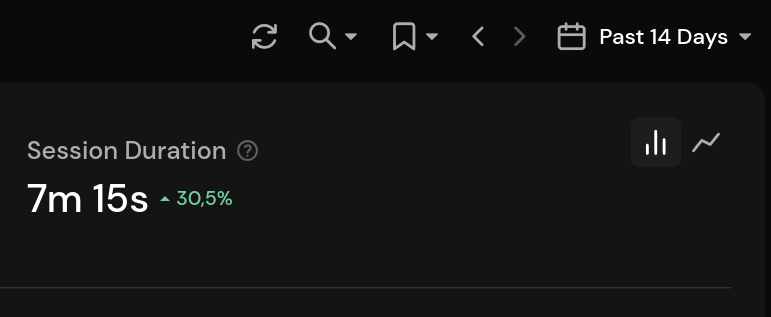
- We've fixed and improved to the session duration and time on page calculations
In addition to these changes, we have fixed many other minor bugs.
In this update, we added sampling, which greatly improves performance when you have a lot of data. From now on, if you have more than 10 million unique visitors on the dashboard, the results will be sampled. This reduces the accuracy of the statistics by about 1%, but makes loading the statistics ten times faster. In addition, we now cancel running queries when you change the filter, also improving loading times.
Another important bug fix that affected performance was an infinite loop that would occur if statistics couldn't be loaded before the request was canceled due to a timeout. If the statistics calculation for a panel takes more than 30 seconds, it will now abort and display "No data".
As always, you can find our full changelog here.
Introducing Pirsch 2.1
17. September 2023
Pirsch 2.1 is the first major update since we launched 2.0. We've added new statistics, custom metrics, and a few convenience features.
Support for Client Hints
Let's start with some technical changes: we now support client hints. Client hints are a modern approach to identifying a visitor's operating system and browser, currently only supported in Chrome. They allow us to more reliably identify Chrome and OS versions, such as Windows 11 and Chrome OS, which weren't supported before.
If you use any of our SDKs or API, be sure to upgrade and set the new client hint fields for your requests.
Changes to the Dashboard
There are two minor changes to the dashboard in this release.
First, we have added a refresh button so that you no longer have to refresh the whole page to load the latest statistics.
On mobile, it is displayed in the graphs panel.
Second, by popular request, the panels now show direct/none and unknown for all stats. This was previously only available in the detail view when expanding a panel.
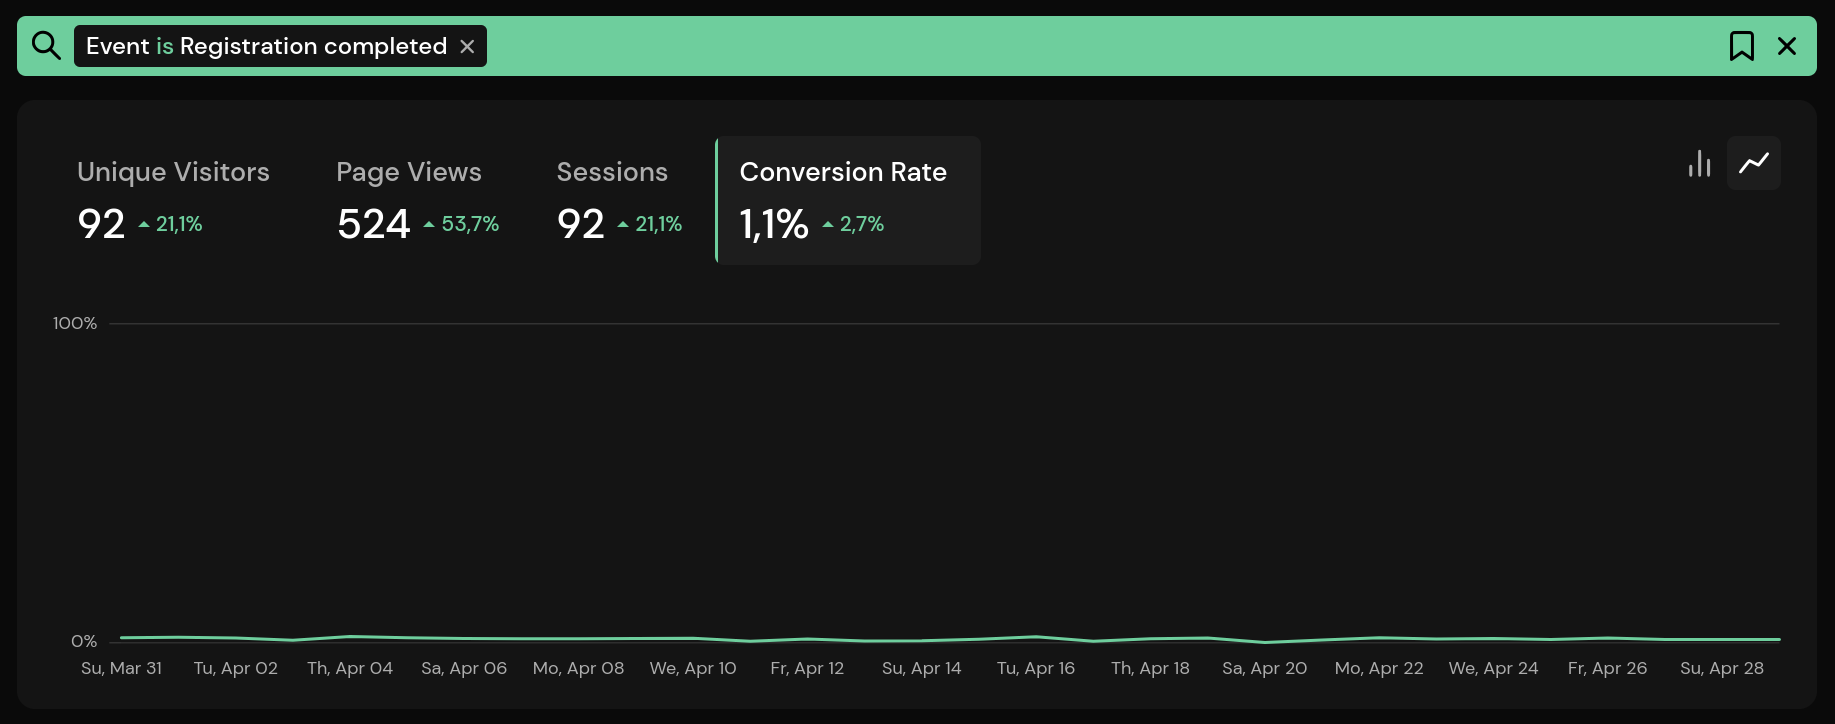
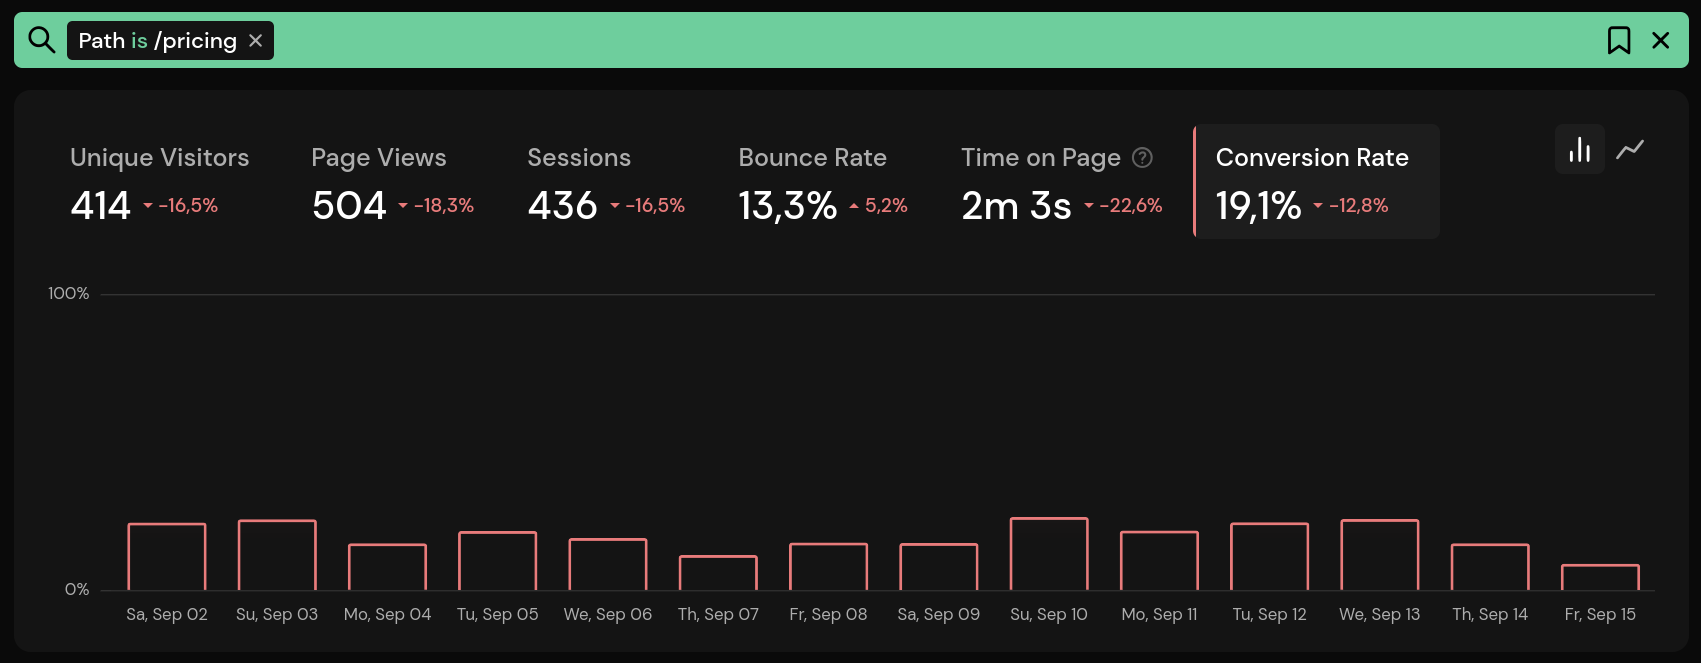
Conversion Rate Graph
The new conversion rate graph shows the conversion rate for a page, conversion goal, or event over time. This helps you identify trends.
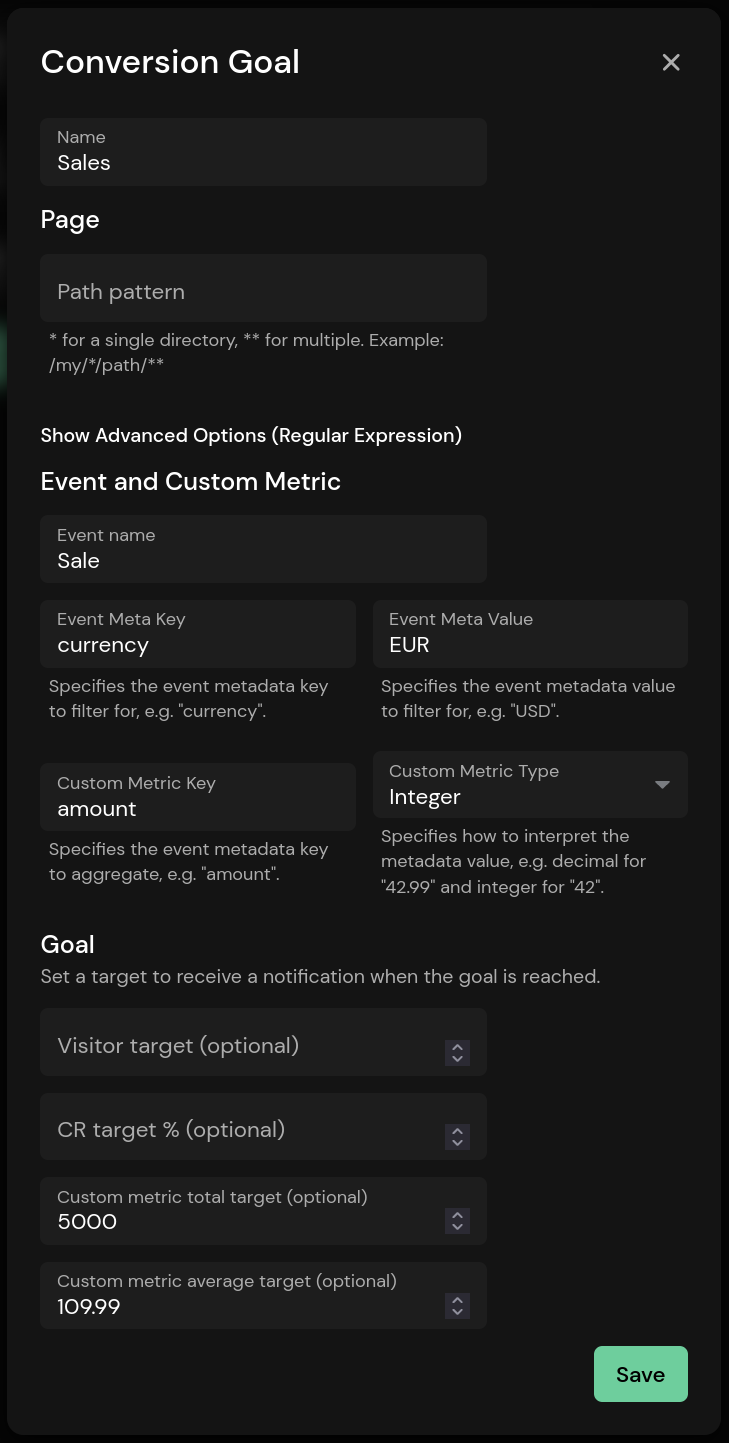
Events for Conversion Goals
When creating a conversion goal, you can now enter an event name and a metadata key and value. The dashboard is filtered by the event and metadata pair. You can combine this with a path pattern or regular expression to filter for the page on which the event was triggered.
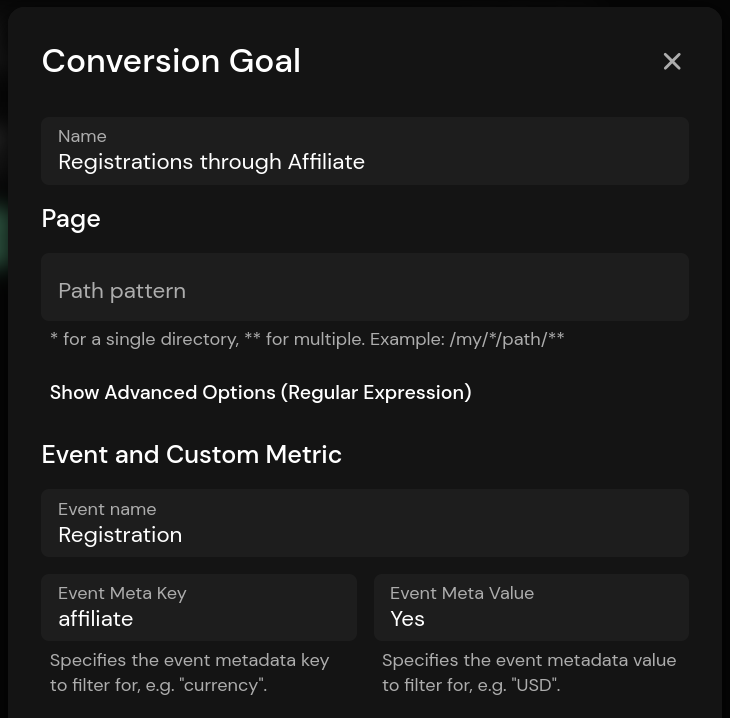
The path pattern is now optional, you only need to set one of the two to create a conversion goal.
Custom Metrics
Custom metrics are a new Pirsch Plus feature. They are a versatile tool to help you track various metrics for custom events and are part of the conversion goal dialog.
One example is e-commerce revenue and attribution tracking. Simply create a new conversion goal, specify the event you want to use to track revenue, and a metadata field you want to use to generate the stats. In the screenshot below, the field used to track revenue is called amount and the type is set to decimal.
When filtering by conversion goal, you'll see two new graphs for average and total revenue.
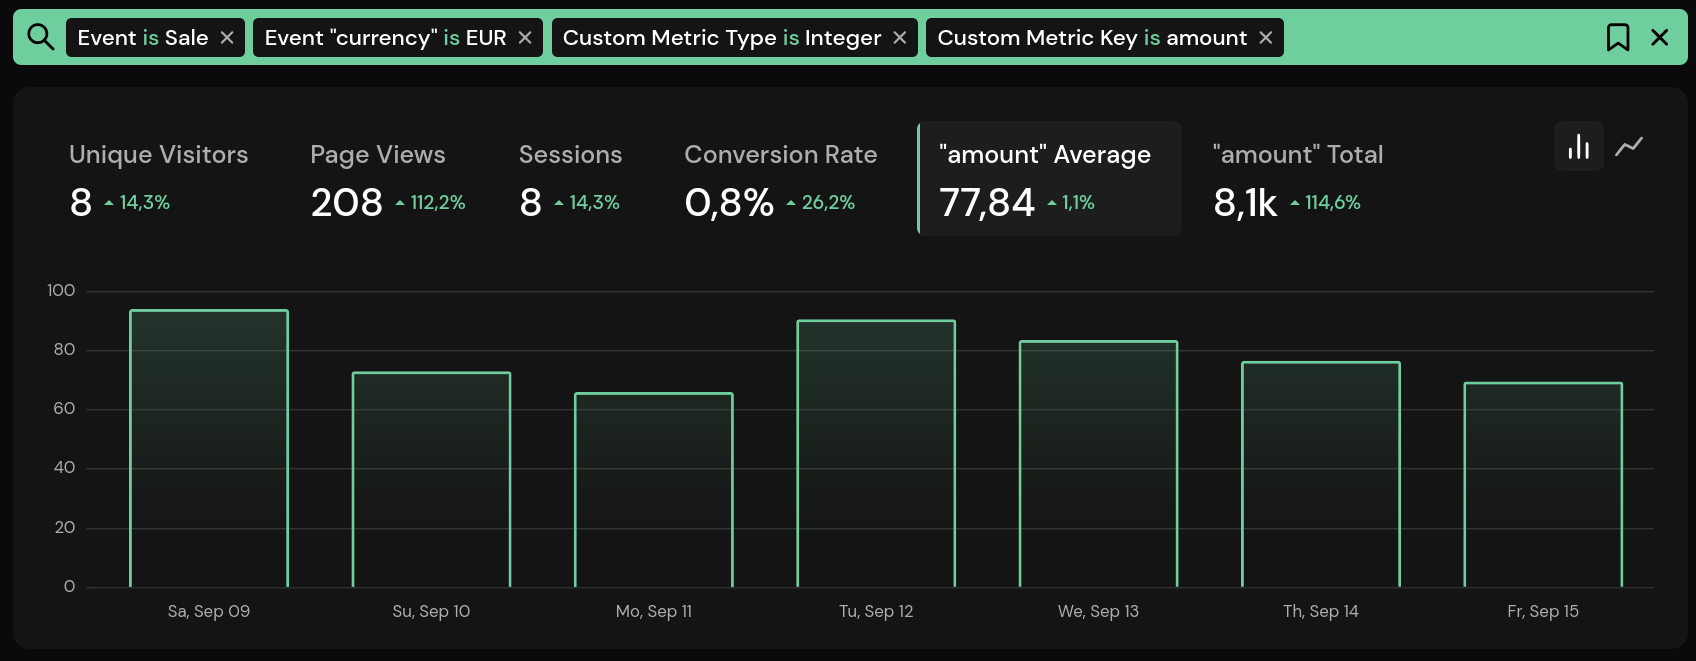
Of course, you can combine this with additional filters, such as the referrer or UTM parameters for ad attribution.
As with path patterns, you can set a target to receive a notification and optionally delete the goal automatically.
To create the Sale event, you would simply create an event as you're used to, with amount and currency as metadata fields.
pirsch("Sale", { meta: { currency: "EUR", amount: 199.98 } });
Custom metrics are not limited to e-commerce. You can use them for anything you want. Since they just use regular metadata fields, they are backward compatible and can be used on existing events.
As always, you can find our full changelog here.
Announcing Pirsch 2.1
14. September 2023
Pirsch 2.1 is in its final testing phase! This will be the first point release since 2.0.
We will be rolling it out on the 17th of September, this Sunday. Expect a few minutes of downtime as we're also doing some maintenance on our infrastructure.
Check out our changelog here.
A Few Improvements to White Labeling
06. August 2023
We've made a number of minor improvements to White Labeling, including:
- New options to hide the login button and footer on custom domains
- You can now select which color palette should be displayed by default (light or dark mode)
- Added a color switch for your customers/visitors on public dashboards
And a few other smaller things. Read the changelog.
Scripts on Custom Domains and Small Improvements
08. July 2023
After the release of Pirsch 2.0 on Saturday, we fixed a lot of bugs thanks to your feedback.
This release includes an improvement to the color picker for custom themes and scripts on custom domains.
Scripts on Custom Domains
It's now possible to serve all scripts on your own domain. After configuring a custom domain, you can copy the snippets from the integration settings page. We've shortened the file names, so that they won't be blocked.
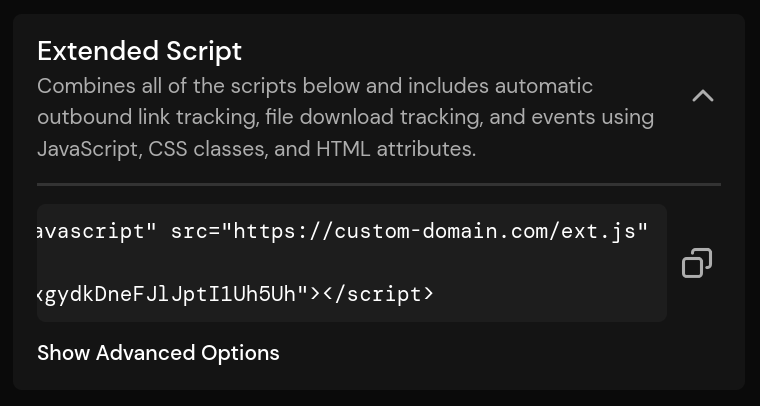
- pirsch.js becomes p.js
- pirsch-events.js becomes e.js
- pirsch-sessions.js becomes s.js
- pirsch-extended.js becomes ext.js
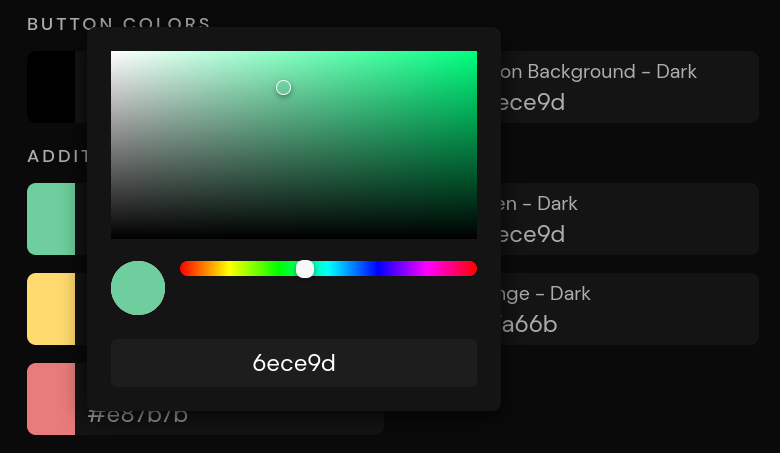
Better Color Picker
The color picker for custom themes used the browser default, which is inconsistent across browser vendors and in some cases doesn't allow you to insert hex codes and freely select a color.
We added a custom color picker that unifies the experience across all browsers and supports all formats supported by our dashboard.
Introducing Pirsch 2.0
08. July 2023
Today we are releasing Pirsch 2.0, with new exciting features, improvements and a foundation for future development! Without further ado, let's start with the changes.
User Interface Improvements
We've made a number of major and minor improvements to the dashboard. Most notably, the top navigation is now cleaner and easier to read. It also makes more room for new features (more on that later).
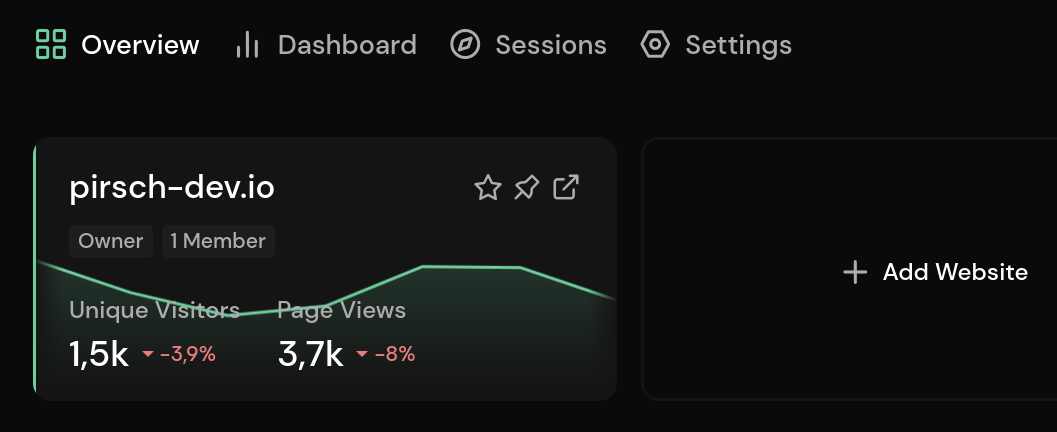
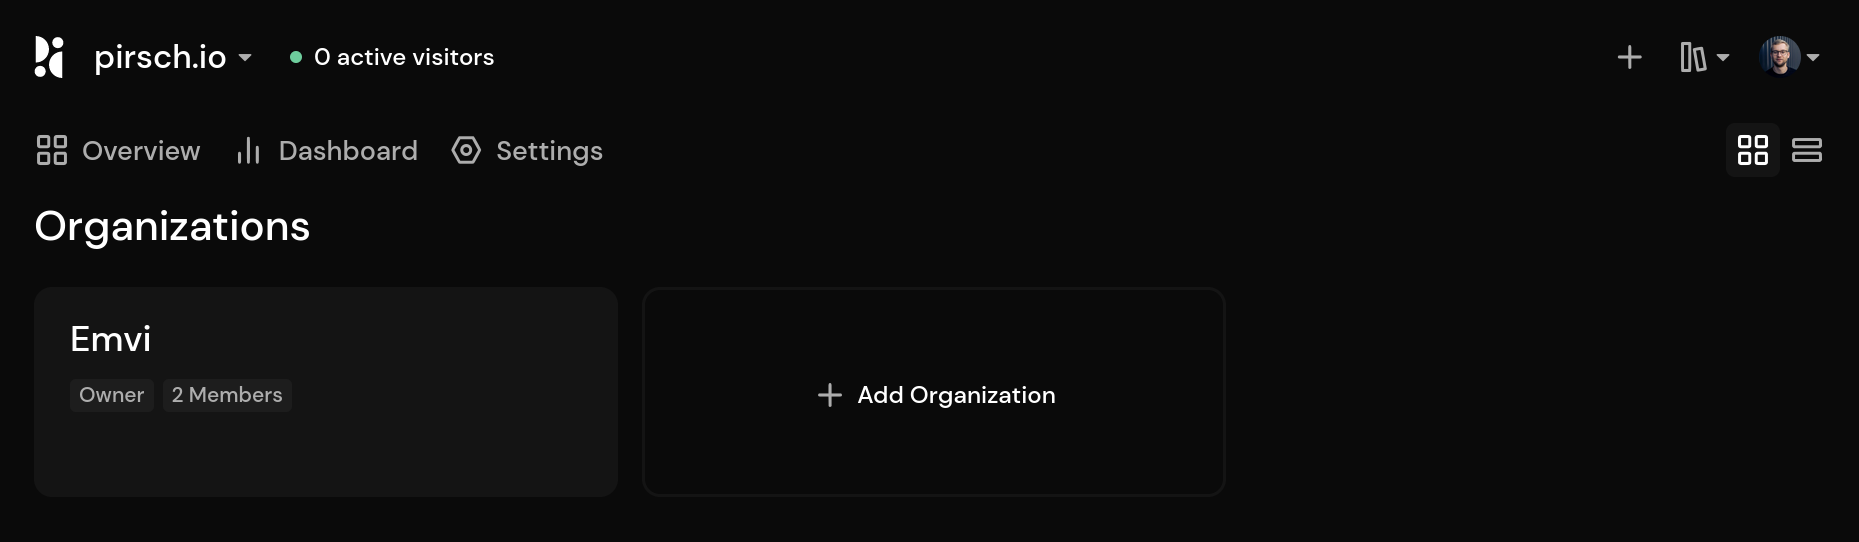
The new overview lets you see some basic statistics for all of your sites and easily switch between them. It also shows the number of members and lets you know if you're the owner of a dashboard. The statistics on the dashboard are cached and not updated in real time.

Another notable change is the new integration overview after creating a dashboard and in the settings. There was some confusion about when to use which integration. The new collapsible sections make it easier to see your options and choose the right one.
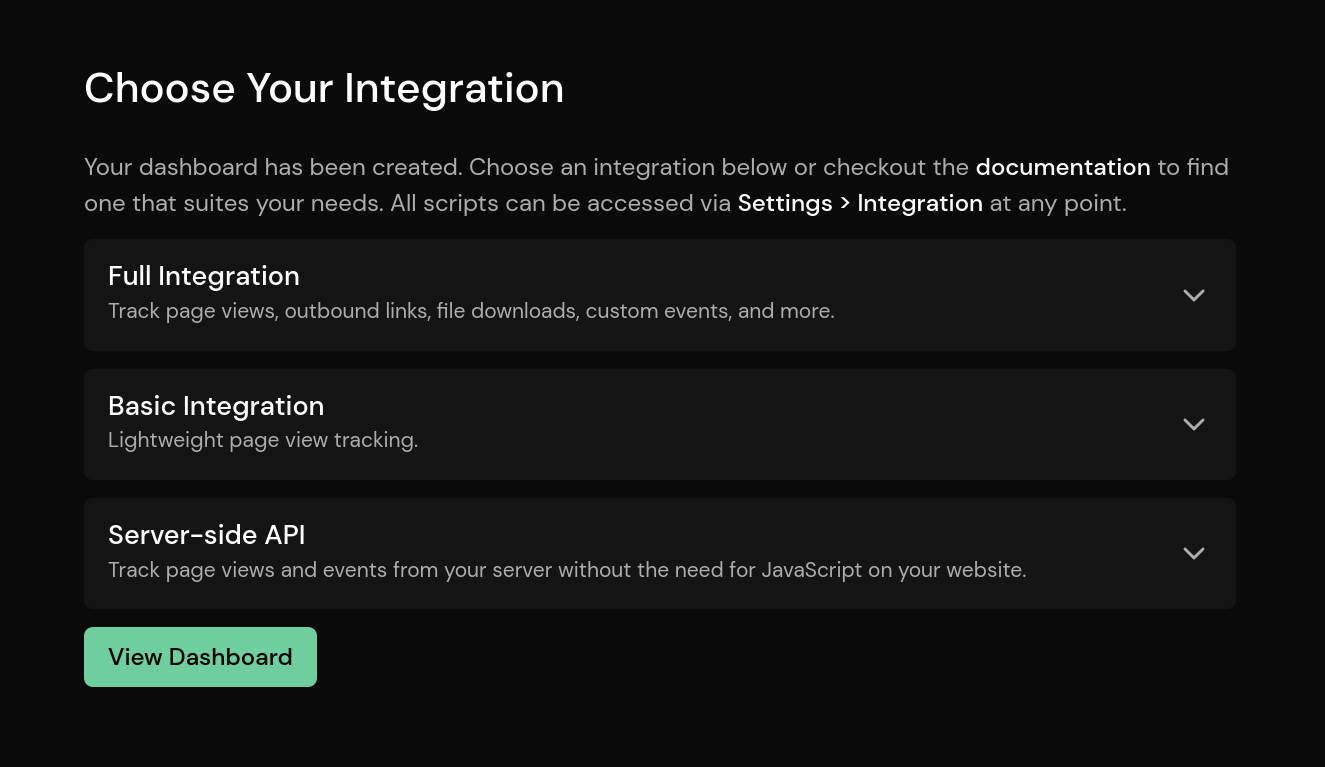
One feature that has been requested for a while now is a full-width dashboard. And guess what. We added one.
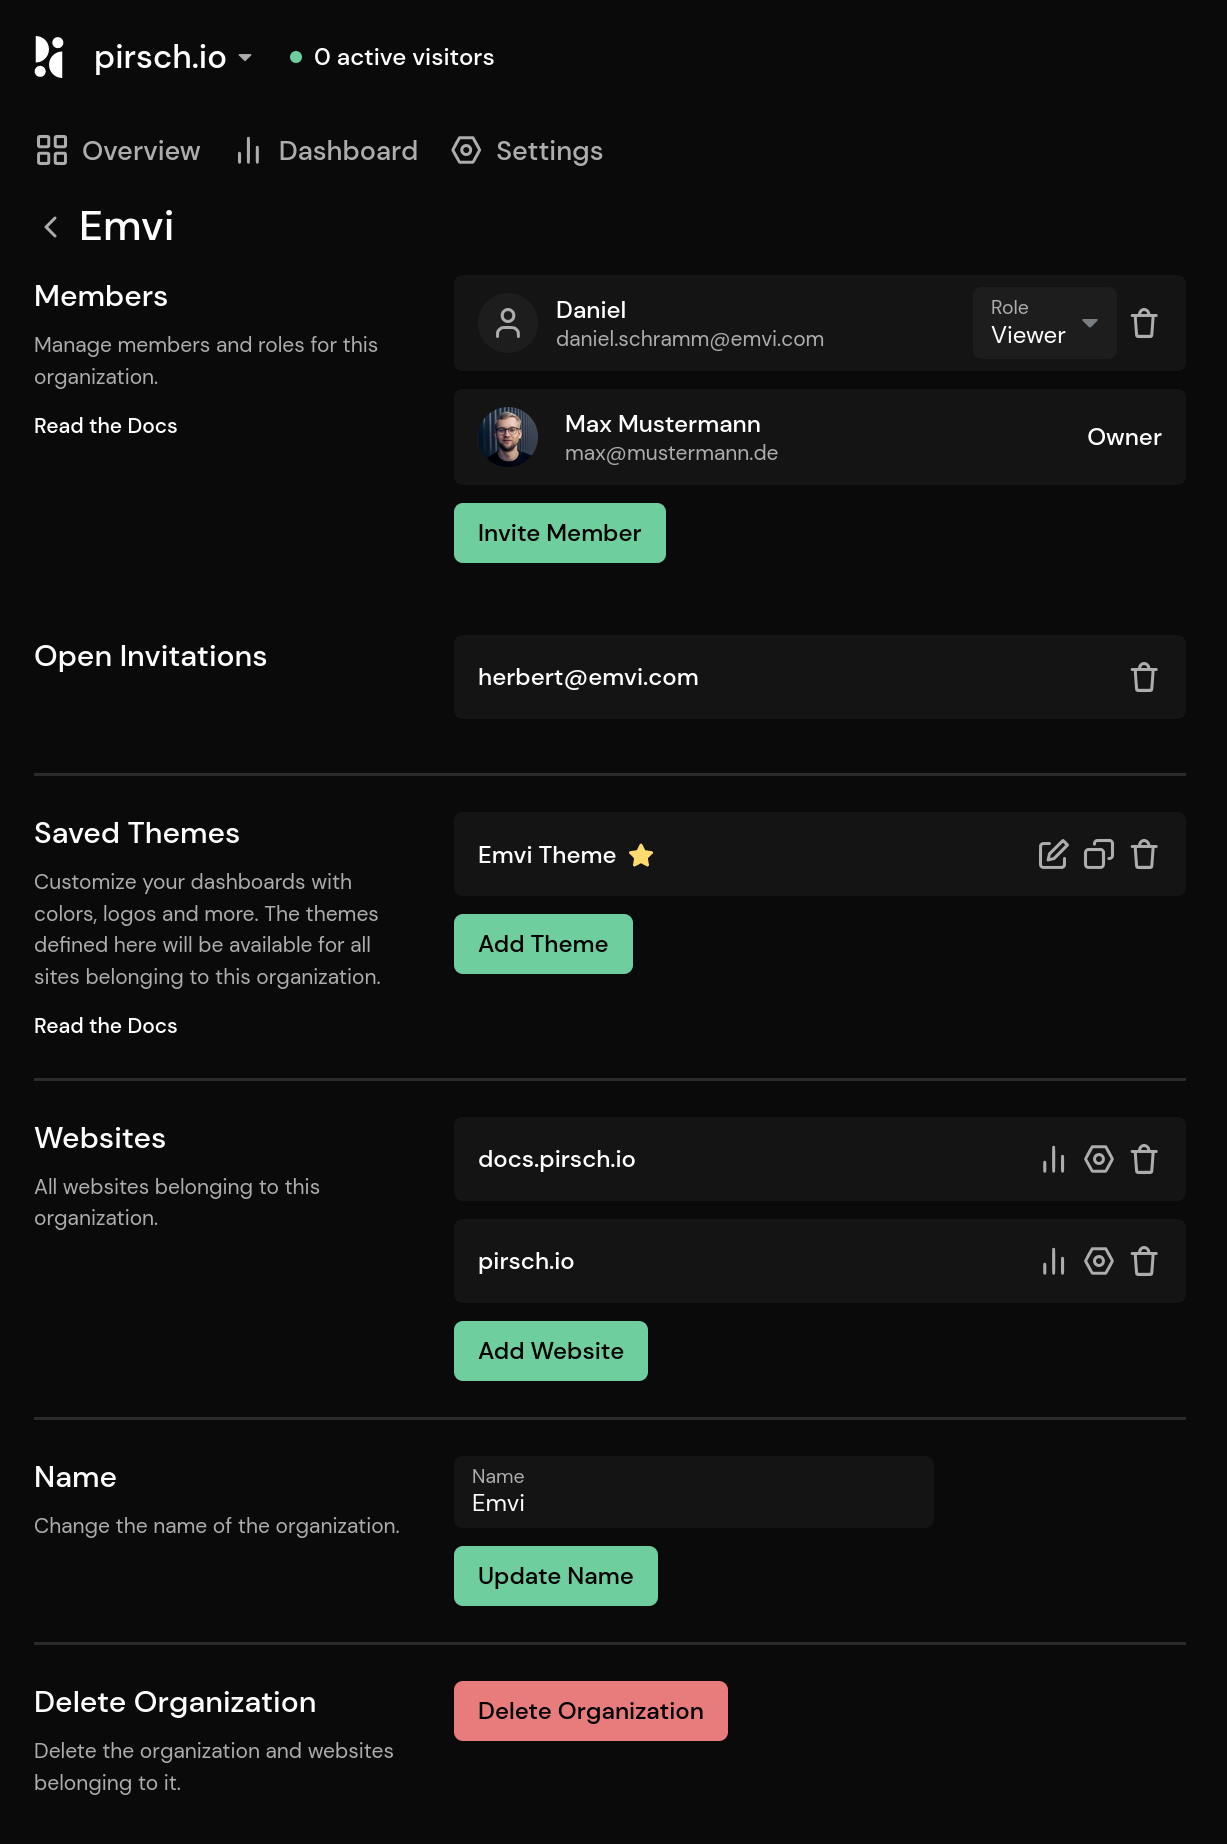
Organizations
Our first Pirsch Plus feature in this release! Organizations help you manage sites, themes, your team, and your clients.
You can add team members and customers to an organization and manage their permissions. They get access to every dashboard that belongs to the organization, so you can make changes to permissions centrally. Previously, you had to sign in with the account that the subscription was created for. Now you can simply have your team member add sites on your behalf.
Themes are made available to your team members. Speaking of themes...
Themes and White Labeling
Probably the most anticipated addition for many of you are themes and custom domains! This allows you to fully white label the experience for you and your clients. White labeling is available with Pirsch Plus.
Create themes for yourself or your organization and assign them to dashboards. You can change the logo, favicon, color, border radius and more! Setting a theme also affects emails.
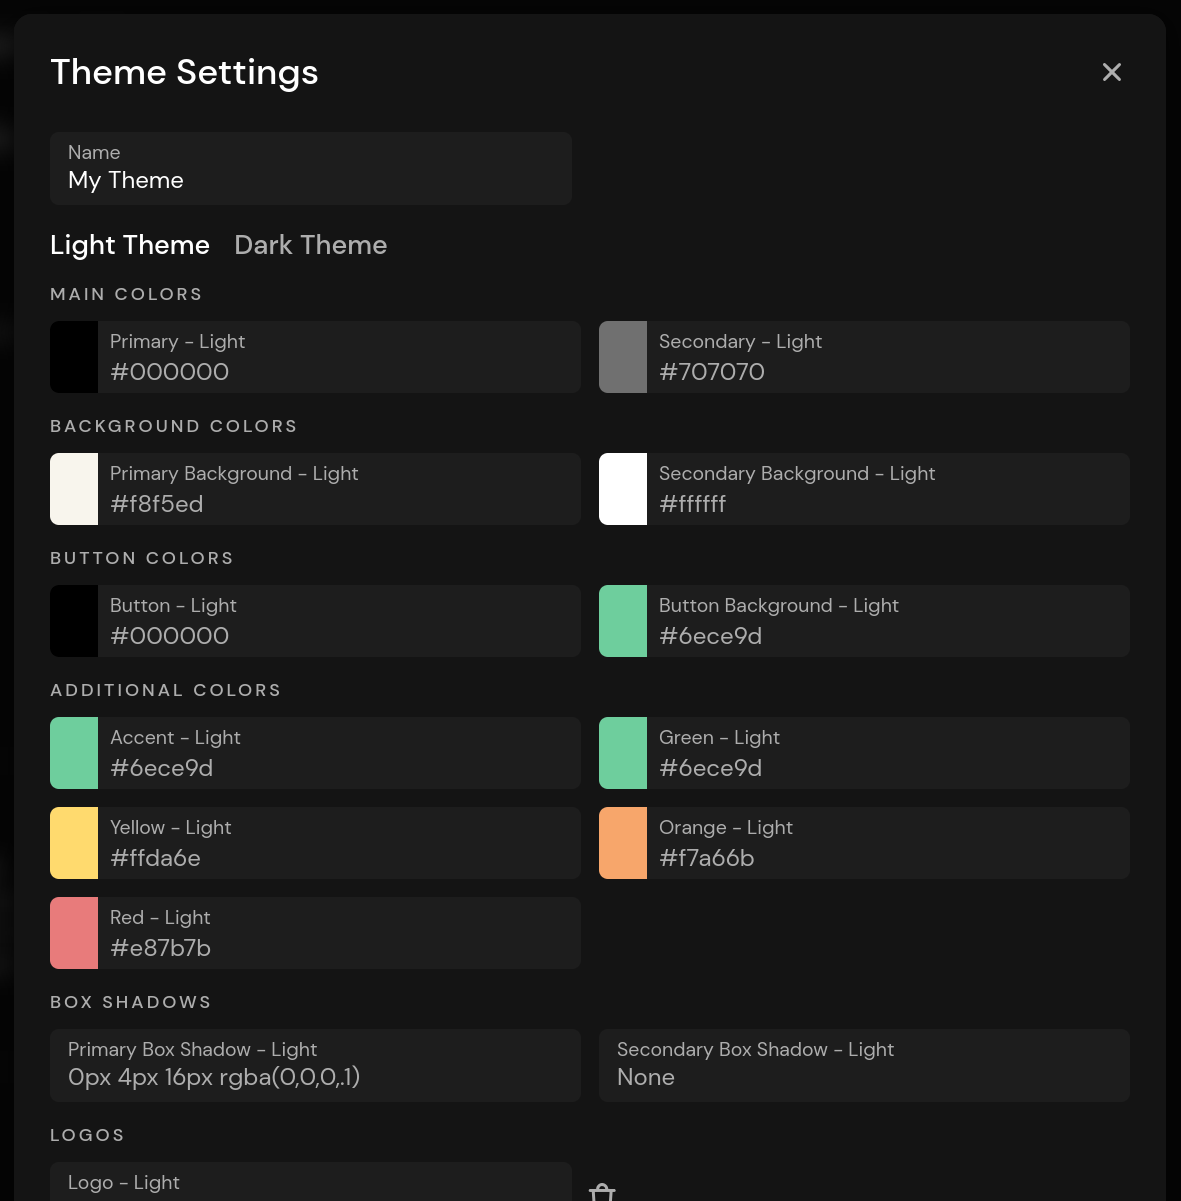
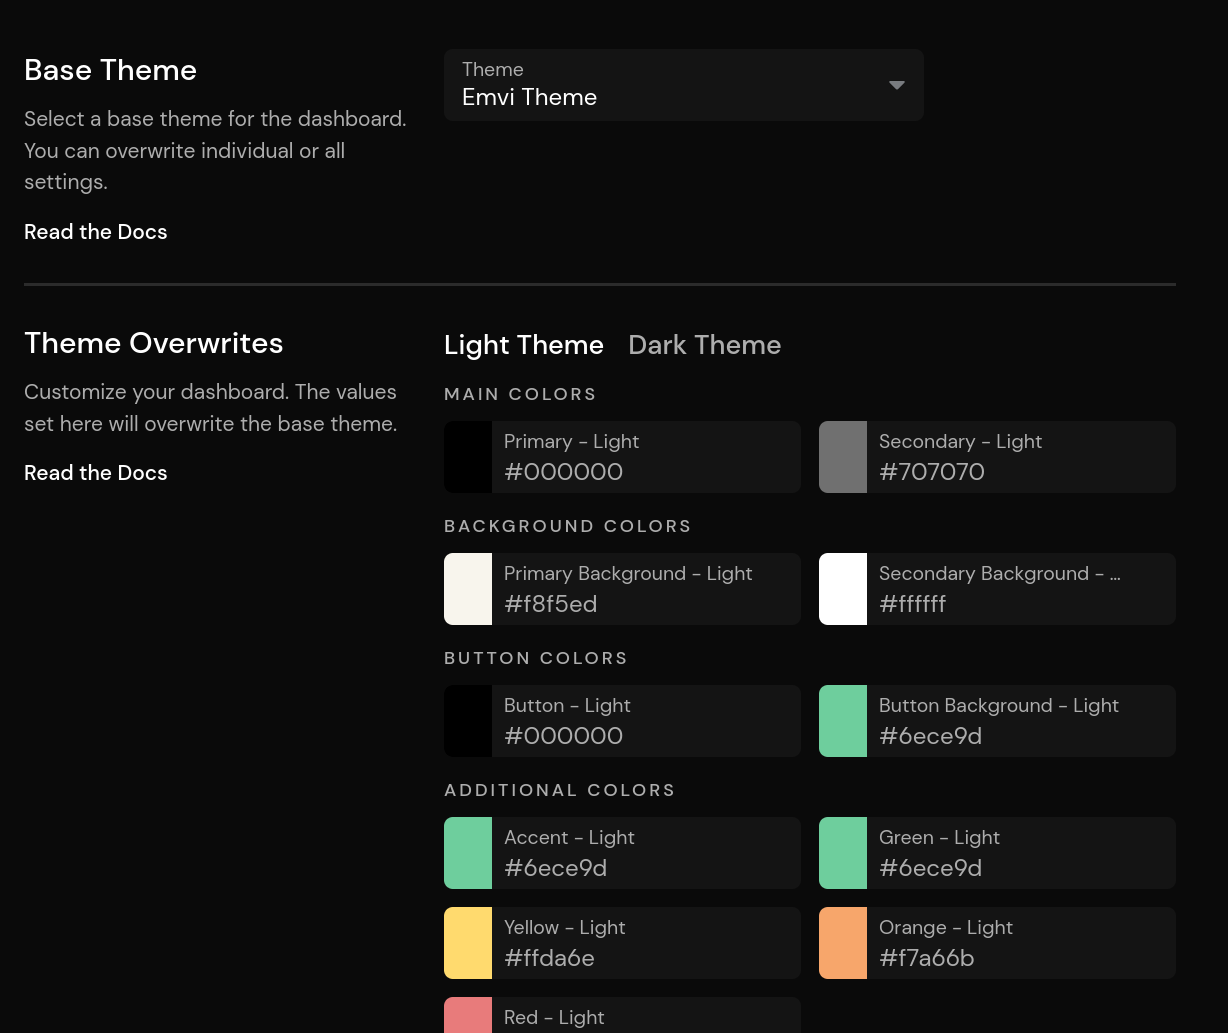
A theme sets the default look for your dashboards, but you can override individual settings on the new Theme Settings page.
To fully white label Pirsch, add a custom domain to your dashboard. We will automatically request an SSL certificate for your domain and host the dashboard on it. All features are accessible through your domain, so customers can sign in, reset their password, and more, all from your domain.
The only exception (for now) are our scripts. Integrations will still need to load scripts and make requests to pirsch.io.
If you don't want to upgrade to Pirsch Plus, you can try out themes by applying a temporary set of rules on the Themes Settings page.
Pirsch Plus
Pirsch Plus is our new pricing tier for more advanced features, such as white labeling, but also for future additions. We called it "Plus" because you don't lose anything if you're on our Standard plan, but it will help you get more value out of Pirsch.
For an overview of what you'll gain by upgrading to Pirsch Plus, please see our pricing page. You can upgrade your subscription on the Billing page.
There are two minor changes for new users:
- With the Standard plan, you're limited to 50 dashboards. This is far more than most people need, so we feel this limit is reasonable. If you're an existing customer, you still have unlimited sites.
- Free trails will now start after the first website is added. This means that new users can start their trial whenever they want, without the pressure to use the free trial right after signing up.
Pirsch Enterprise
We now officially offer an enterprise version of Pirsch. You can either host Pirsch yourself or get a custom setup for your needs. Please contact us if you're interested.
Other Changes
Under the hood, we have made many technical improvements that are (hopefully) not visible to you. For example, we completely rewrote the dashboard state management. You can check our changelog for details.
If you find any problems, please don't hesitate to contact our support. We usually respond quickly and try to fix bugs the same day.
What's next?
Pirsch 2.0 is the foundation for many more features. Here are some of the things we have planned for the near future:
- Monetary values for custom events
- Easy segmentation of page views by tags
- A comparison view
- Website monitoring
- Funnels
We hope you like what we have done in this release! Feel free to share your feedback with us via email or social media.
Your Pirsch Team
26. June 2023
Pirsch 2.0 Announcement
We've been busy building Pirsch 2.0 for the past few months and are finally ready to announce a release date!
Pirsch 2.0 will be rolled out on the 8th of July. You should expect a downtime of a few hours as we're also improving our infrastructure.
More details will be presented on launch. For the meantime, you can check out our changelog here.
06. June 2023
Euro Payments and New Payment Methods Available
If you had problems with credit card payments in the past, you can now pay using PayPal or SEPA. We have also included the possibility to change to Euro on the billing page.
Go to Billing Page
08. May 2023
New Google Analytics Import
Until today, we were transforming the data imported from Google Analytics into our own format, which led to inconsistencies between the two dashboards. It also gave the impression that you could filter on the imported statistics, which is not possible as Google does not provide raw data and we rely on aggregated statistics.
We have decided to change our approach and the imported stats are now stored as-is. This means that if the statistics displayed on the dashboard contain imported data, you will no longer be able to filter on them.
Please also note that since we are storing one data point per day, there will be differences in totals. For example, the total number of visitors will be different if you filter by time period. Looking at days individually will be accurate.
We strongly recommend that you re-import your statistics. Please delete your existing imported data on the Danger Zone settings page first. Make sure you don't accidentally delete more than you want! You can then re-import your statistics as you've done before.
More information can be found in our documentation.
28. April 2023
This is a small update adding a feature that has been requested for a while now: changing the domain for a dashboard. The new feature can be found in the settings (danger zone).
We also fixed a bug regarding events. Before, creating an event would start a new session with the page view count at one if required. This led to some smaller inconsistencies as no page view was recorded. The counter will now start at zero, fixing the inconsistency.
08. April 2023
Using custom events on your website has become a lot easier. We added a new script allowing you to:
To use these features, replace the pirsch.js script with the pirsch-extended.js script. Note that outbound links, file downloads, and 404 error pages are tracked as custom events, which count towards your monthly page view limit. More information can be found in our documentation. You can also find a demo on GitHub.
We also started working on what will become Pirsch 2.0. The basis for a lot of new features we have panned for the future. For the first iteration, we plan to add support for team management, theme settings, and custom domains.
01. February 2023
We updated our DPA (Data Processing Agreement). You can always download the latest version from the resources menu or by clicking here.
27. January 2023
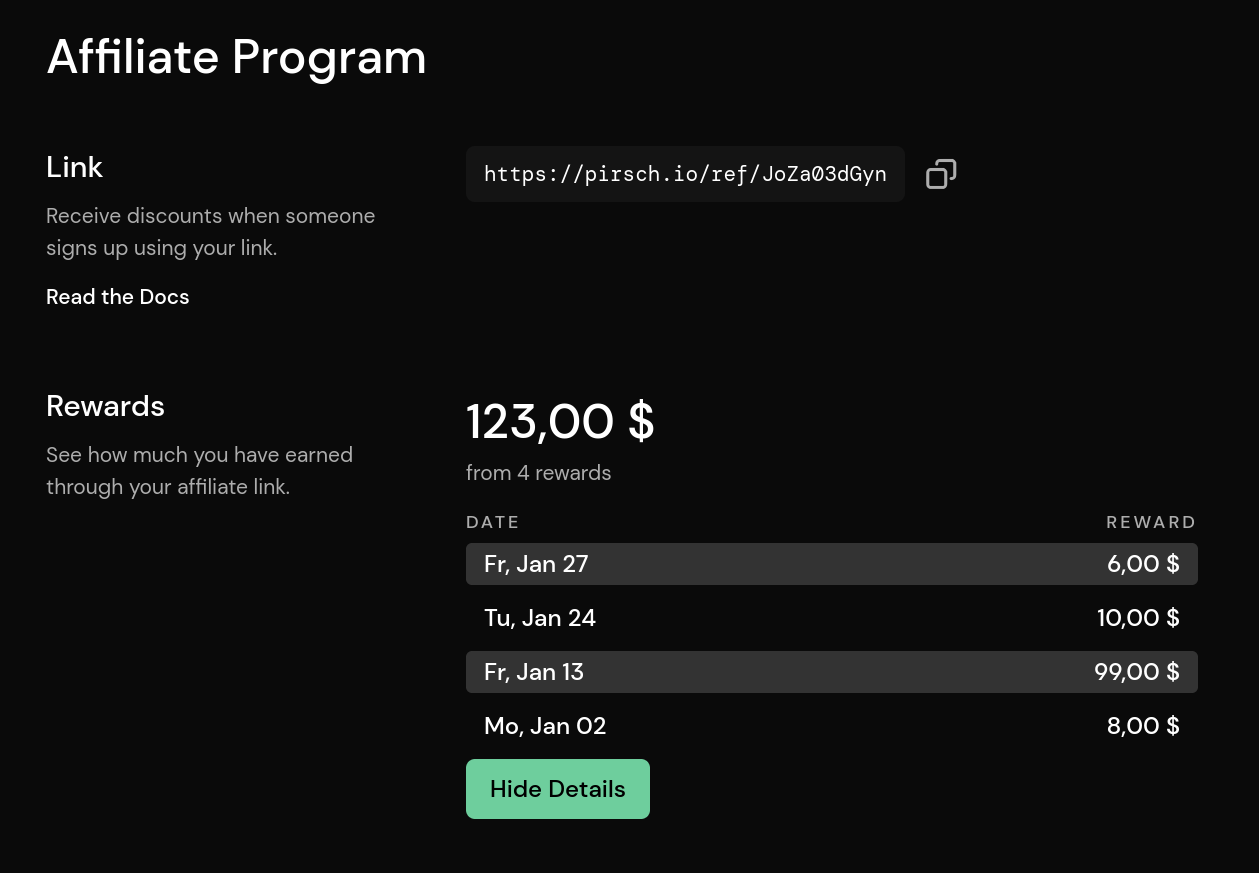
We now have an affiliate program!
Our affiliate program allows you to earn rewards for referring new customers to Pirsch. You can simply copy your personal affiliate link, and every time someone signs up for a subscription, a reward is added to your account balance.
Simply navigate to the affiliate page from the account menu in the top-right corner and copy your personal link.
Learn more
05. January 2023
We've been busy over the holidays and worked on the next major update for Pirsch. The new version brings some convenient functions and improvements to the dashboard.
Changes to the Settings
The settings pages have been restructured, as they got bloated.

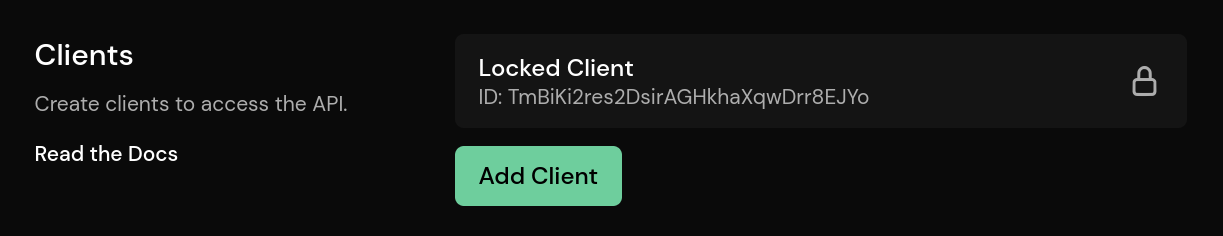
We added locks, allowing you to prevent accidentally changing or deleting something on the web interface or through the API. Locked elements can only be unlocked manually on the settings page.
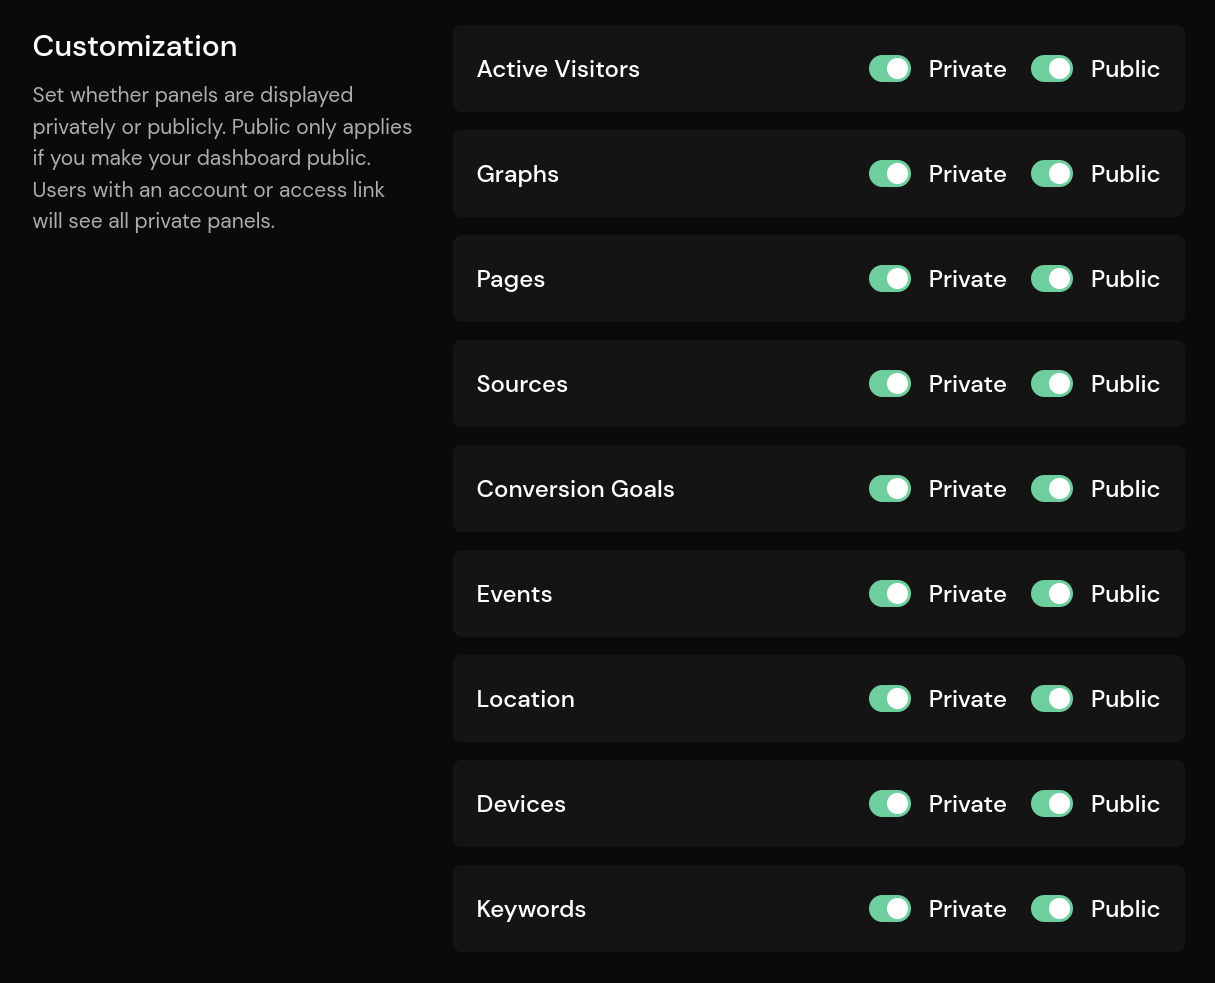
The panels on the dashboard can now be customized. You can set whether a panel should be displayed on the private, public, or both dashboards. By default, all panels are enabled.
Viewer Time Zone
We now use the viewer's time zone by default. Before, you would always see the dashboard in the configured time zone. This is now used as a fallback if the visitor has no time zone configured.
Other Improvements
We made a few subtle improvements to the dashboard. Most importantly, we improved the authentication so that you can now stay logged in for a year in a secure way.
The subdomain if you add a dashboard will now be pre-filled, and we improved the data fetching mechanism so that pending requests are now cancelled if you change the filters while panels might be still loading.
Changelog
27. November 2022
Today we have released an update, including the new version of our open-source core. This will bring event filters more in line with other filters, improve bot filtering, and fix an issue with our session extension feature.
Improved Bot Filter
We now filter bots based on their IP address. This will greatly improve the quality of your data and reduce costs. We block all larger known data centers and servers that are known as spammers.
You don't need to worry if you use our API to send statistics. The filter mechanism won't affect your own servers running in the cloud or on-premise.
Excluding Events
Before, excluding an event would only return statistics for visitors that created any event at all. Now, it correctly returns all visitors without the event and no event at all.
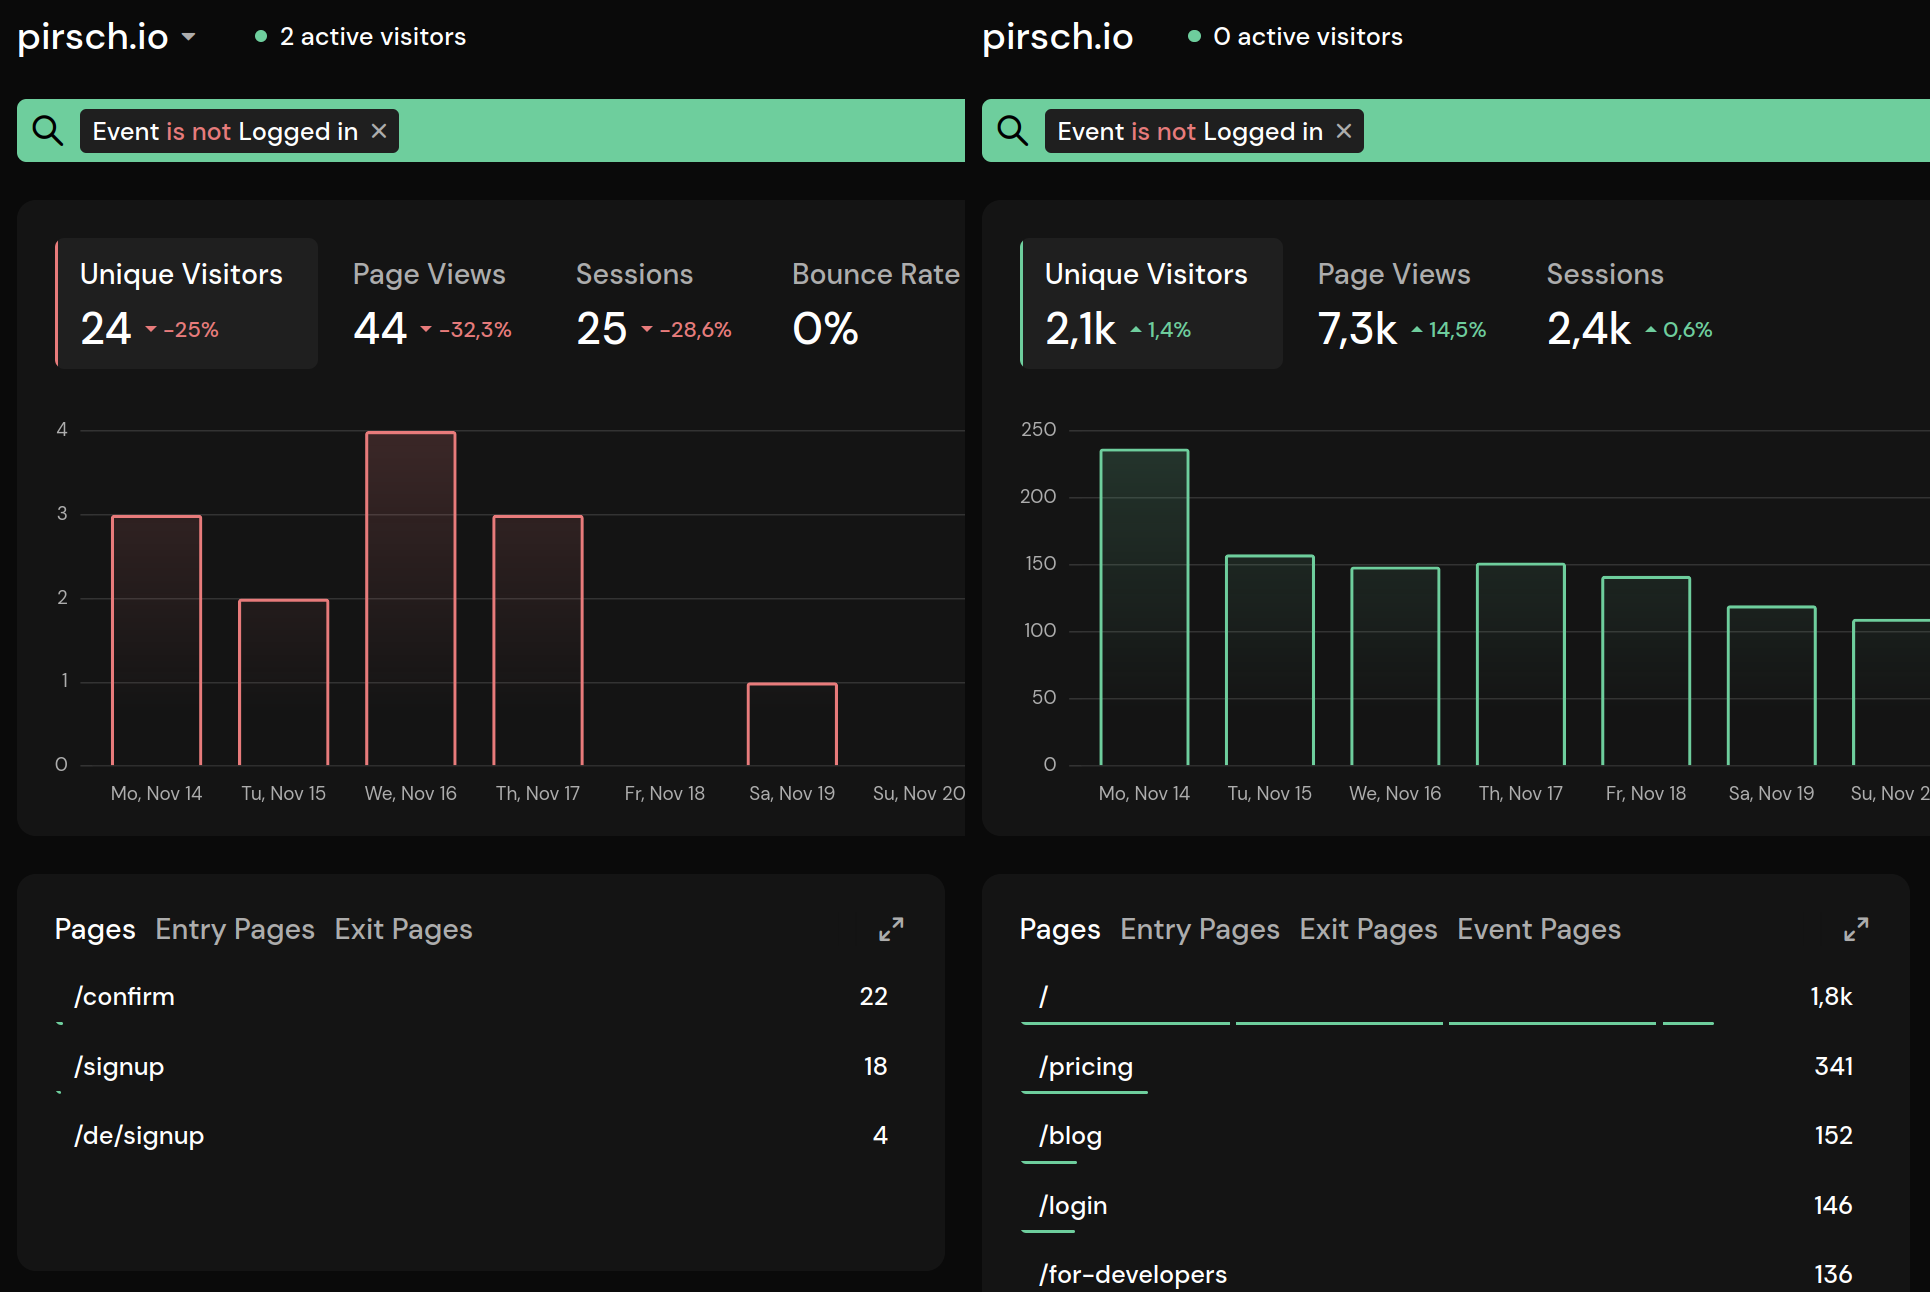 Left: before, right: after
In addition, filtering for an event will now return all pages a visitor visited during a session. We have added a new entry in the page view panel Event Pages that shows the pages an event has been triggered on.
Extending Sessions
We have fixed an issue with our session extension feature. Sessions are reset after 30 minutes if the visitor doesn't switch pages. You can now extend sessions using a new script or our API. This is useful if you would like to see how many people are on your site, even if they don't swap pages, like in an app, for instance.
Please note that extending sessions comes at an additional cost. One session extension will be counted as 1/10th of a regular page view. If you update a session once a minute, keeping it alive for 10 minutes will be counted as one page view.
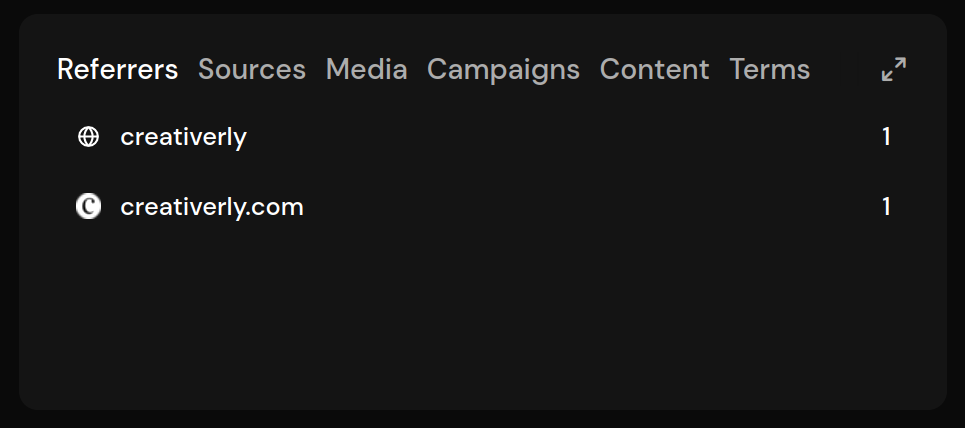
UTM Content and Terms
We have moved the UTM Content and Terms panels. If you filter for an UTM parameter (sources, media, or campaigns), they will now show up in the sources panel.
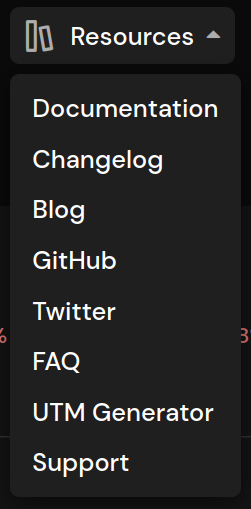
Support
We noticed that a few users had trouble finding a support channel. So we have added a new entry to the resources menu.
Changelog
01. October 2022
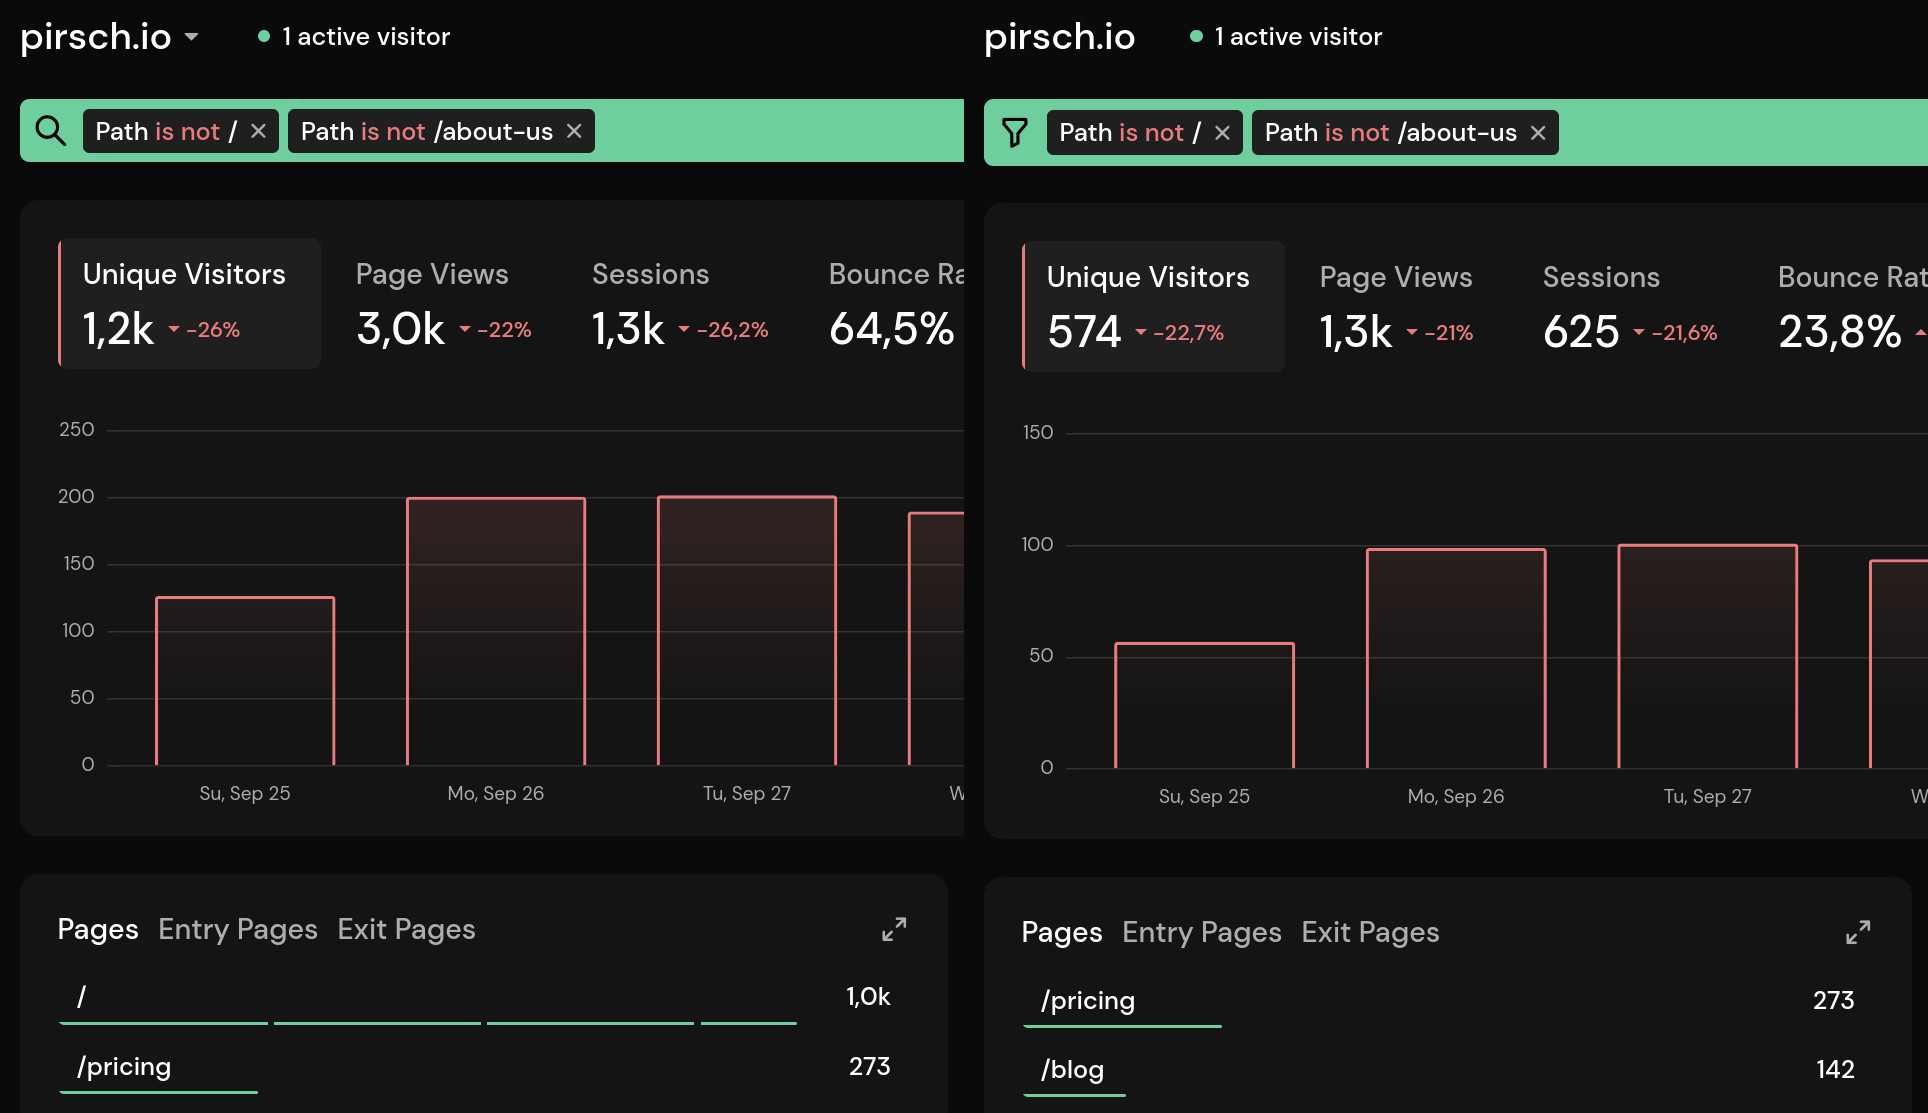
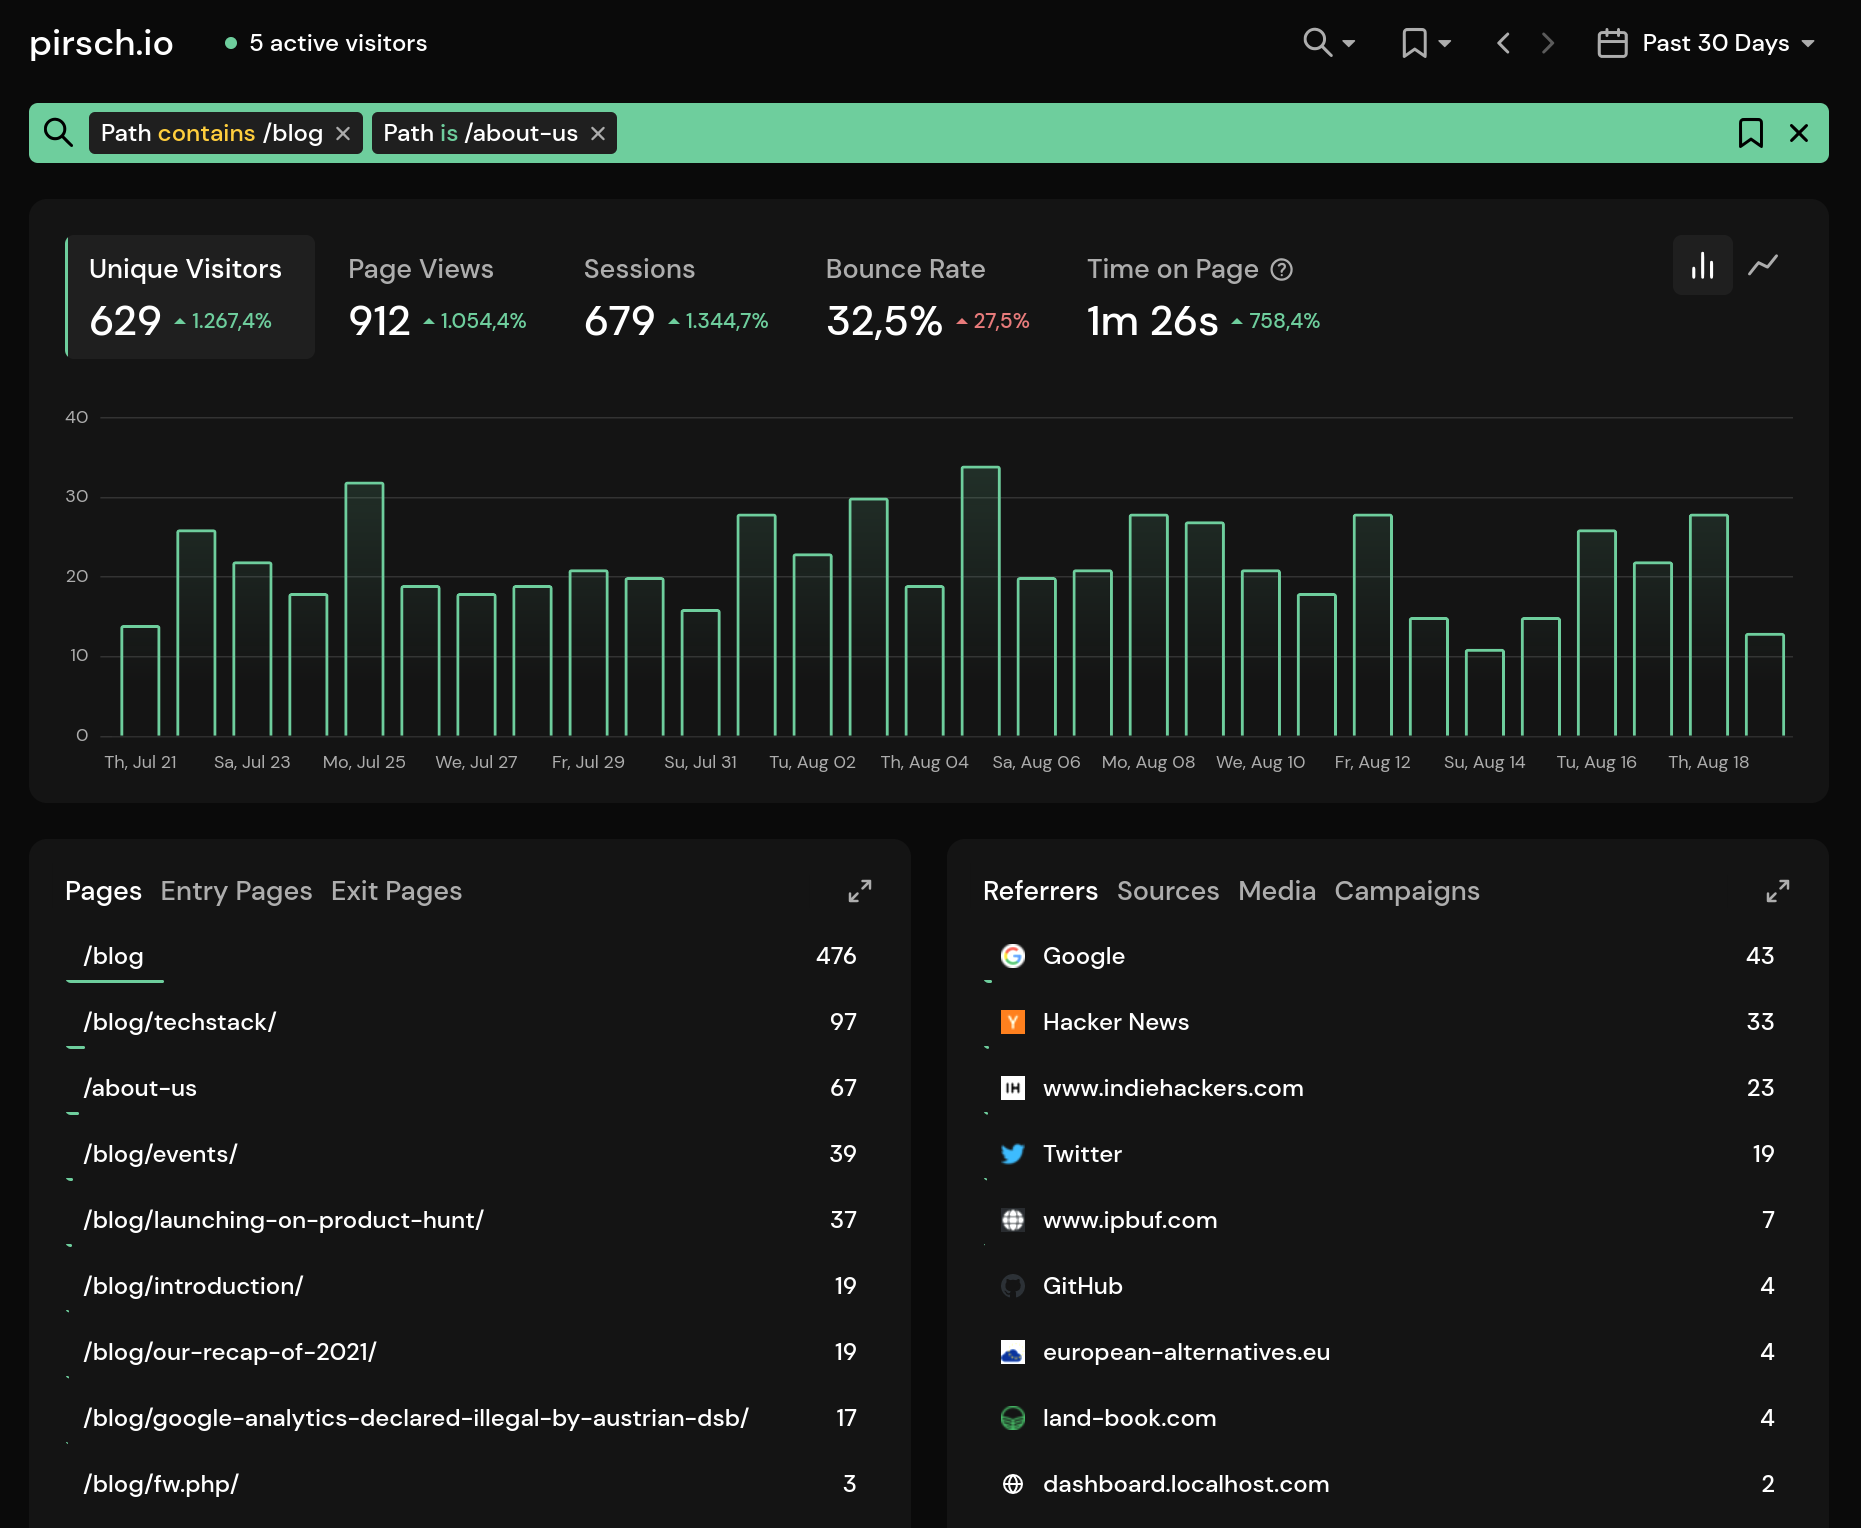
This update includes improvements to the filters. Before, parameters of the same type (like path, country, etc.) were connected using a logical OR. This meant that if you wanted to exclude multiple pages, for example, the filter would do nothing. We've changed this so that negated parameters ("is not") are now connected using a logical AND.
Here is an example: Before, the filter could be read as "Path is not / OR Path is not /about-us", which had no effect. Now it can be read as "Path is not / AND Path is not /about-us", correctly excluding both pages.
Changelog
04. August 2022
This version adds some convenience features. You can now:
- configure the time visitors are counted as active on the dashboard configuration page
- display the number of active visitors in the tab from the account settings page
- configure advanced options and test the JavaScript snippet from the dashboard configuration
Check out our changelog for a list of all changes.
19. August 2022
We're proud to announce the next big update to Pirsch! Let's go through the new features and changes one by one.
New Filters
The filters have been completely reworked and now allow you to set multiple values for the same field.
The contains selector filters results based on your input.
You can click on a value to change it and filter the options by typing, all controllable by keyboard!
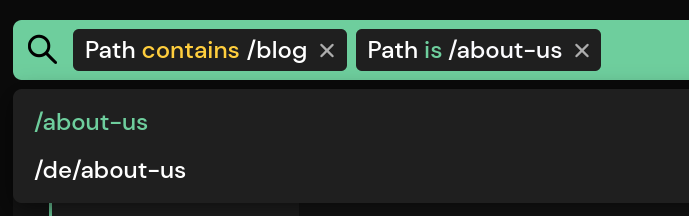
Use the arrow keys to navigate results, press enter to select a value, or press escape to close the selection.
Views
You can now save a set of filters as views for later use. Share views with your team to gain insights that are important for you more quickly.
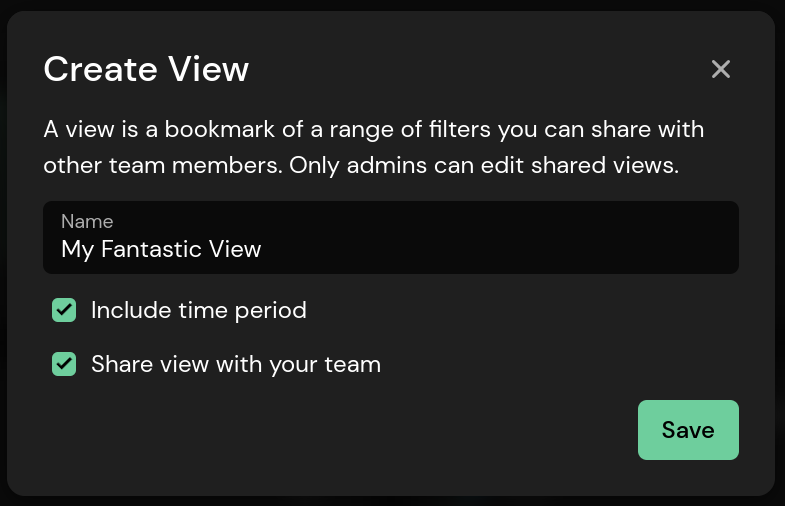
A view can be created by clicking the bookmark icon in the filter bar.
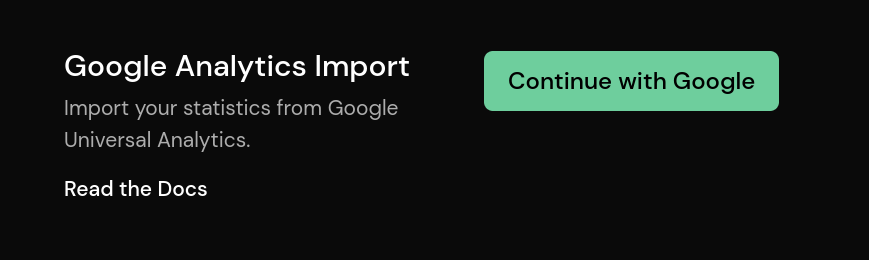
Import Data From Google Analytics
We have made switching from Google Universal Analytics to Pirsch a lot easier. You can now import your statistics on the general settings page.
Please note that we cannot fully reassemble the statistics that you see in Google Analytics and that there will be differences, especially when you use filters.
Set a Dashboard as Favorite
We've finally added a features that has been requested a few times: setting a dashboard as favorite.
By clicking the star icon you can set a dashboard that will be loaded by default after login.
... and more
Of course we made a lot more changes and fixed bugs. One important change is that the entry and exit pages now show the unique visitor count instead of the number of sessions, to align it with the other panels. Also, the percentage now show the relative visitor count compared to all visitors, just like for regular pages.
Check out our changelog for a list of all changes.
01. July 2022
This is a smaller update including one important change if you are a user of our API.
The CF-Connecting-IP, X-Forwarded-For, Forwarded, and X-Real-IP headers have been removed from the API. This means if you rely on these headers, you need to update your integration and set the IP field for the request to the real visitor IP.
How you obtain the real visitor IP depends on your setup. If you are behind a proxy, load balancer, or in the cloud, look up your provider documentation to see which of the above headers contains the real IP address.
We know that this change comes a bit abruptly, but the IP was easily spoofable and most Pirsch users shouldn't be affected by this change, so we decided to roll it out quickly.
Check out our changelog for details.
15. May 2022
Version 1.15 is a huge update with a lot of new features and improvements. Here is what is new!
Multi-Domain Support
Pirsch now has multi-domain support, allowing you to create rollup views and send data from a single website to multiple dashboards. To enable this, open the developer settings and add the domains you would like to send data to or receive from.
On your website, add a comma-separated list of domains to your JavaScript snippet using the data-domain attribute or use the API.
Keyboard Shortcuts
We have added keyboard shortcuts to make it easier and quicker to navigate your statistics. Press the left and right arrow keys to change the current period. Single keys are used to change the filter.
Access Tokens
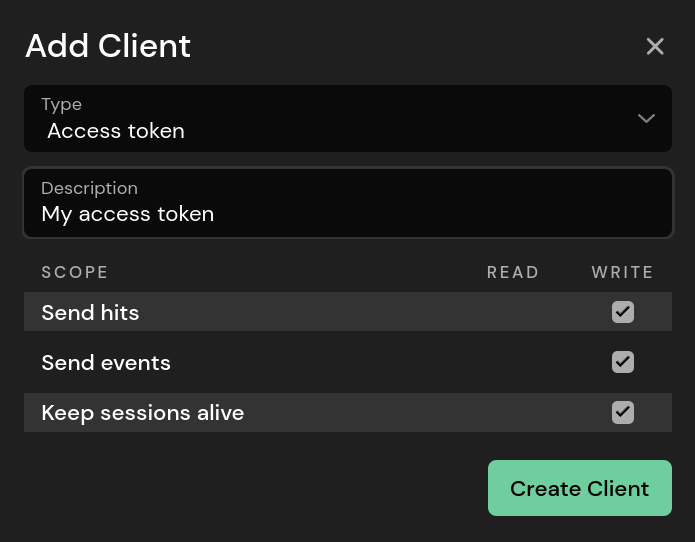
Sending page views and events using the API requires requesting an access token using oAuth. We now offer write-only access tokens that don't require an additional step and are better suited for stateless programming languages where you can't store the oAuth token between requests, like PHP.
To generate an access token, navigate to the developer settings and click "Add Client". Change the type to "Access token".
Multiple Email Reports
You can now add multiple email reports for the same email address. This is useful if you would like to receive a weekly and a monthly report, for example.
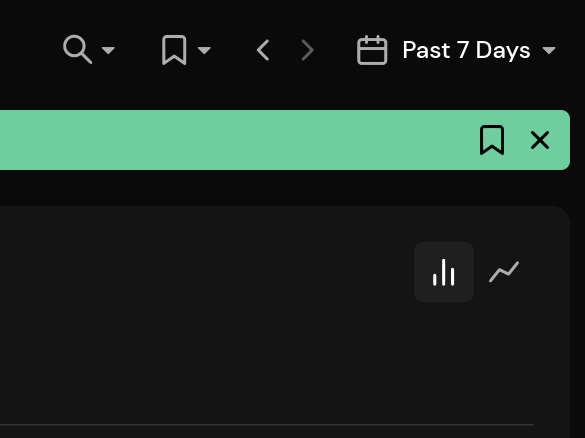
Hide the Graphs
The graphs can now be hidden to reduce the space they take up.
Filter and Sort All Data
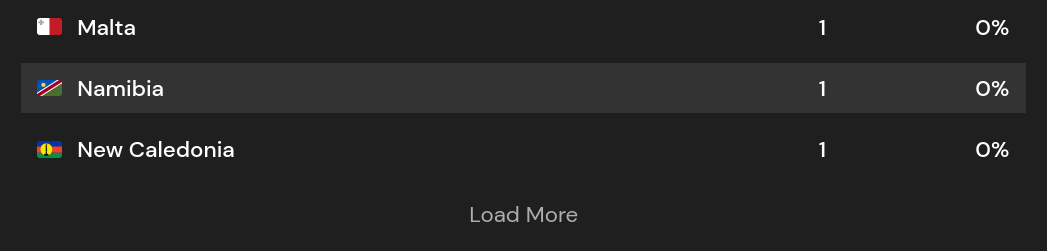
Tables are now filtered and sorted on the server, so you are no longer limited to the top 100 results.
We also added pagination to allow you to load more results.
Improvements
We made a bunch of improvements, including:
- conversion goals and events can now be created from the panel and are always visible
- added 25% separators in panel lines
- the chart labels are now responsive
As always, check out our changelog for a full list of changes. We will update our documentation in the coming days to include instructions and more details for all the new features.
14. April 2022
This is a smaller update mostly fixing bugs, but it also changes the growth calculation when viewing a single day.
Filtering for a day will now compare it to the same day the week before, instead of the previous day. "Today" will take the time of day into account.
You can view the full changelog here.
02. April 2022
It's time for an update! The latest major version of Pirsch brings a lot of new features, fixes, and improvements. These are the most significant changes:
- you can now click on the graph to filter for a date
- results can now be grouped by week, month, and year, in addition to the regular per-day view
- calculating the growth for the "Today" filter will now take the time into account instead of comparing to the whole last day
- we have improved bot filtering using simple heuristics
- the JavaScript integration now has an option to filter pages using a regular expression
- the email report has been improved
- the sample for conversion goals when using a regular expression is now saved and the dialog has been overall improved
- the domain deletion dialog now contains the hostname for easy copy and paste
To see all the changes, please visit our changelog.
22. February 2022
This is our second feature update this year, adding new features to the dashboard and usability improvements.
For a better use of space, the height of the main graph has been reduced.
You can now filter for the last month or for the current month up until today. Clicking on one of the newly added arrows will move the selection to the previous or next interval.
We have merged the platform and screen size statistics with the operating system and browser panel. This will reduce scrolling and make the dashboard more compact.
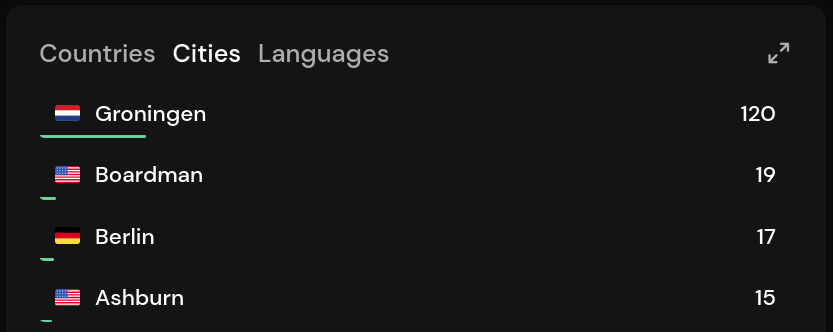
The cities panel now also includes the country's flag to make it easier to see what country a city is located in.
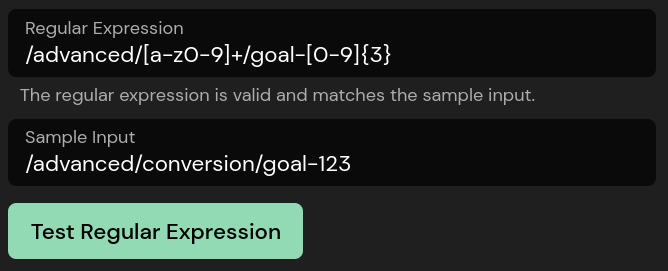
Using our conversion goal feature, you can now add your own regular expression. You can test your expression against an input. The syntax needs to be compatible with RE2 (an error will be displayed if your regex can't be compiled).
We made more improvements to the core and our backend. For details, check out our changelog.
19. January 2022
We've released a smaller feature update, adding hourly page views, sessions, and bounce rate.
Since our last larger update in December, we've also fixed a whole bunch of issues. Most significantly, the average session duration was calculated incorrectly. Check out our changelog for more details.
09. January 2022
When we launched Pirsch last year, we set a lower price tag because we felt our feature set was too small. This has now changed and we did make adjustments to our pricing. Here are the changes for our three most used plans:
- 10k page views: $48 -> $60 annually
- 100k page views: $96 -> $120 annually
- 200k page views: $144 -> $180 annually
The monthly pricing for these plans will stay the same. Existing subscriptions will be updated with the next billing cycle.
For all updated prices, please refer to our pricing page.
21. December 2021
The year is almost over, and we would like to thank everyone who supported us. You can find a recap of 2021 in the article linked below, including our plans for 2022 and changes to our pricing.
Our Recap of 2021
12. December 2021
This month's update brings some behavior changes and a new way to access the API:
- events can now be filtered by entry and exit pages (and the other way around)
- popular referrers are now grouped (google.com and google.de will both be displayed as Google for example)
- OS version numbers are now shortened to reduce clutter (10.11.5 will now be displayed as 10.11)
- sessions will now be reset when the referrer or a UTM parameter changes and no longer count as bounced if an event is send
- we have added a new API endpoint to list all events including metadata and filter by metadata keys and values
The API can now be accessed by creating a "user client" on the account page (click on your name in the top right corner). A client created that way has access to all of your domains and more functions, like creating, deleting, and modifying domains and their settings. In the coming days, we will add more details and descriptions of the new endpoints available on our documentation.
As always, to see all changes you can view our changelog.
07. November 2021
It has been about a month since our last product update. This updates contains usability and dashboard improvements, bugfixes, and new features. We also have a special offer at the end for you!
Let's start with the usability and dashboard improvements:
- we added a search to the domain selection
- the light/dark mode preferences will now automatically be detected (set to "auto" in the account settings)
- the account timezone settings have been removed. Instead, the timezone is now automatically pre-selected when adding a website
- we added links to your public dashboard to the settings page, if configured
The following new features are now available:
- you can now set the time range filter to "live", to automatically update the dashboard statistics every 30 seconds and load statistics for the past 10 minutes
- we added a parameter to hide the menu and footer (add ui=none to the URL) for embedded dashboards
Finally, we teamed up with Dailytics for beautiful and customizable email reports! You can get 50% off for the first two months by using the code PIRSCH50.

As always, to see all changes you can view our changelog.
08. October 2021
We are live on ProductHunt! Feel free to leave us an upvote and a review.
Visit ProductHunt
25. September 2021
In our latest major update, we made significant changes to the core functionality of Pirsch, improving the performance, the acurary of statistics, and added more filters.
The most fundamental change is that we now roll forward sessions. Data points like the referrer, collected on the first visit, are now available on all successive page views, allowing you to analyze the full visitor journey and see where someone originally came from on any page he visits. Events are also now connected to sessions and allow more granular filtering.
If you would like to learn more about the technical changes, please refer to our changelog.
Here is a list of changes we made to the dashboard:
- referrers are now grouped by hostname (if possible). Filtering for a referrer will reveal the full list of links visitors came from
- statistics can now be filtered by the entry and exit page, in addition to the regular page filter
- the entry and exit page panels now include the entry and exit rates
- filtering for a country now displays a city panel
- statistics can now be filtered by "unknown" and are displayed as "null" in the filter list (e.g. "Referrer is null")
- tabs in panels are no longer reset to the first tab if you change the filter
We also extended the free-trial period to 30 days and 100,000 requests.
We had to run a data migration to adjust existing statistics to the new data layout. The data displayed for historical data might not perfectly reflect the new capabilitis of Pirsch.
10. September 2021
This weeks update contains performance improvements and filter inversion.
A filter can be inverted by clicking on the green "is". Click on "is not" to change it back.
Additionally, we made the following changes:
pirsch.js and pirsch-event.js are now gzip compressed- we added a Dashboard button to the menu, which does the same as clicking on the logo. In a future update, clicking on the logo will bring you to an overview of all dashboards
- we fixed filtering by "unknown" statistics (when opening a panel)
View our changelog
04. September 2021
In this smaller update, we have added new screen classes and made some optimizations.
- new screen classes are HD, Full HD, WQHD, UHD 4K, and UHD 5K for higher resolution screens
- the XXL class has been renamed to Full HD (< 1920px)
- devices with zero visitors are no longer displayed on the platform panel
- we added the
defer attribute to our script snippets, we recommend that you add it to your websites
Here is a short example how the defer attribute can be added to the snippet. It will delay the execution of the script after the page has fully loaded and will speed up your page (at least a little bit).
<script defer src="..." ... />
View our changelog
28. August 2021
This updates brings a lot of changes, improvements, and bug fixes to Pirsch. Most significantly, we now collect the page title and you can group page statistics by them instead of the path. This is useful if you dynamically generate pages, like /page?id=123.
The option for this feature is turned off by default and can be enabled on the domains general settings page.
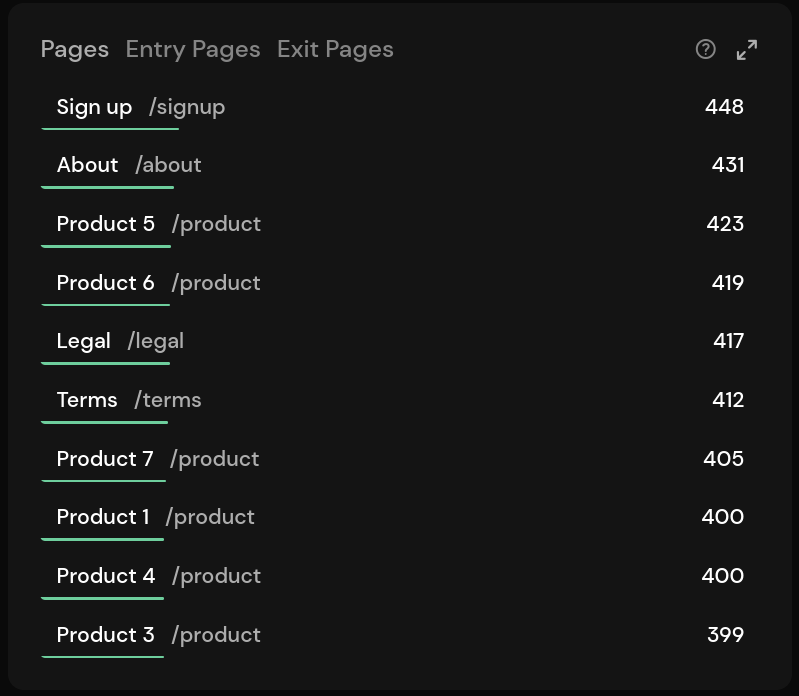
Furthermore, numbers are now shortened. You can hover any number, time, or percantage to show the raw value.
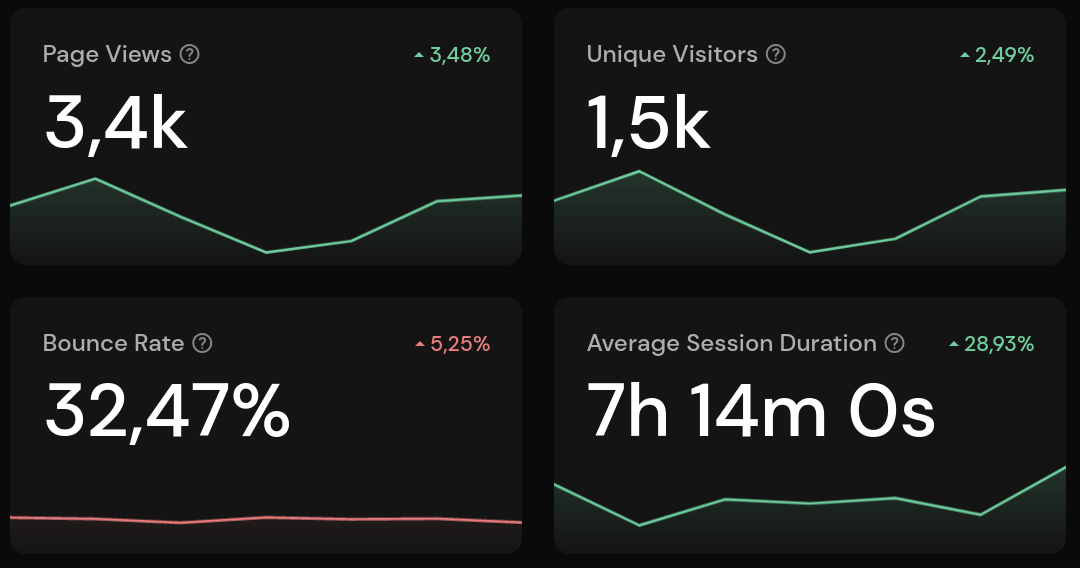
Tables can now be searched. Entering a search query will filter the results by the first column.
Flags are now displayed in the country panel and table.
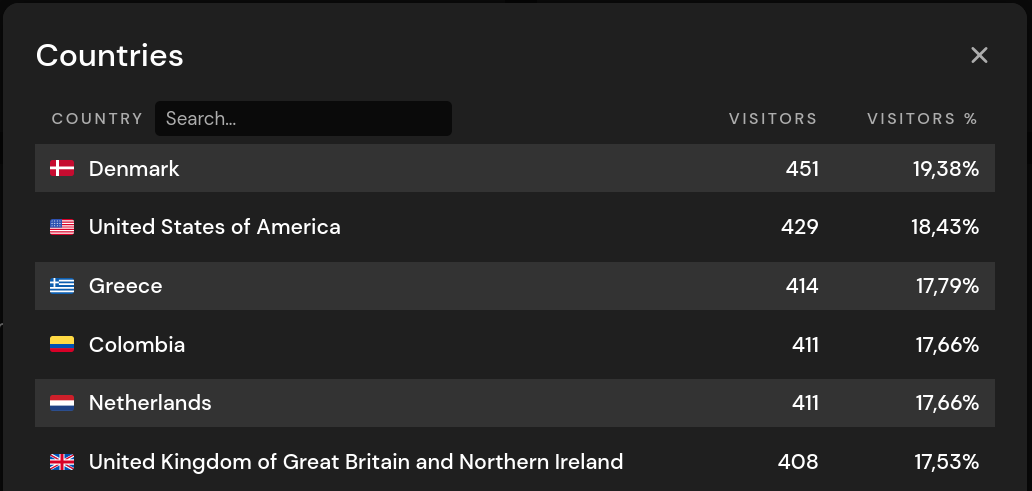
Finally, the dashboard URL is now more descriptive. The selected interval will be shown in a more readable format (today, yesterday, 7d, ...) and we added the domain, so that the correct one is selected if you send someone the link.
And of course, we fixed all known bugs.
View our changelog
09. August 2021
Welcome to the news! This new dialog will show you the latest additions and changes to Pirsch.
You can now use "Yesterday" to filter the statistics for the past day.
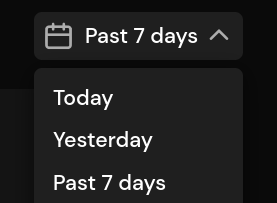
Additionally, we made the following changes:
- visual and textual improvements to the website and settings
- this dialog has been added to show you what has changed since the last update!
- some minor issues have been fixed
View our changelog