
What is A/B Testing?
A/B testing, also known as bucket testing or split testing, is a method of experimenting with user engagement on different variants. These are usually referred to as A and B, although the concept can be extended to more than two variants. The method can be used to compare multiple versions of a single hypothesis. For example, you can compare which headline converts more visitors to a particular action, such as buying a course or product.
When Should You Use A/B Tests?
Experimenting with A/B testing on your website is an easy and effective way to increase conversions. Typically, you want visitors to take certain actions, such as clicking a button or filling out a form. Layout and copy have a big impact on how many visitors take that action. A/B testing allows you to compare different variations of a layout and/or copy and make informed decisions about which works best.
Running an Experiment Step by Step
To run an A/B experiment, you must first define a hypothesis. These are usually tied to a goal, such as increasing sign-ups. For example, you might hypothesize that the headline above the call to action button is unattractive and prevents users from clicking the button.
To test this hypothesis, you would then create one or more new variants for the headline and implement and test the results using Pirsch. Of course, testing requires some time and a significant number of visitors, otherwise the results won’t be reliable.
Tag-based Segmentation
Using tag-based segmentation, implementing A/B testing with Pirsch takes just minutes. Tags can be used for all sorts of things, including A/B testing, but you can also use them for segmentation or to attach metadata to page views. They are always attached to the page view itself, like the path or the page title. Here is an example of how to define tags using the JavaScript snippet integration. The API also supports tag appending.
<script defer src="https://api.pirsch.io/pirsch-extended.js"
    id="pirschextendedjs"
    data-code="your_identification_code"
    data-tag-author="John Doe"
    data-tag-category="blog"></script>
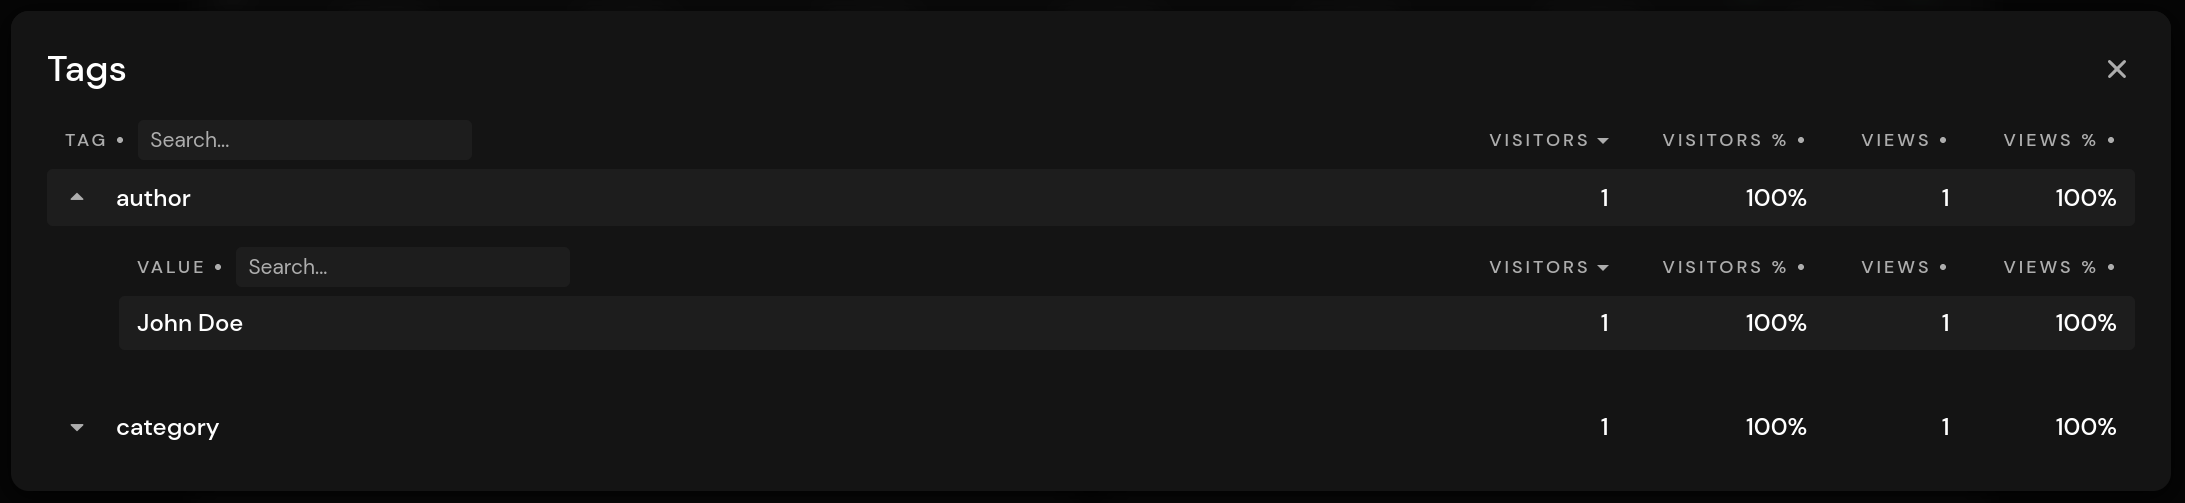
In the example above, data-tag-author and data-tag-category are appended as tag keys to the page view with the values set to John Doe and blog. Tags are always prefixed with data-tag-. You can also set tags without specific values by adding the data-tag attribute with a comma-separated list of tag keys (e.g. data-tag="categoryA,categoryB").
Once attached, tags are listed in the dashboard and can be used to filter results.
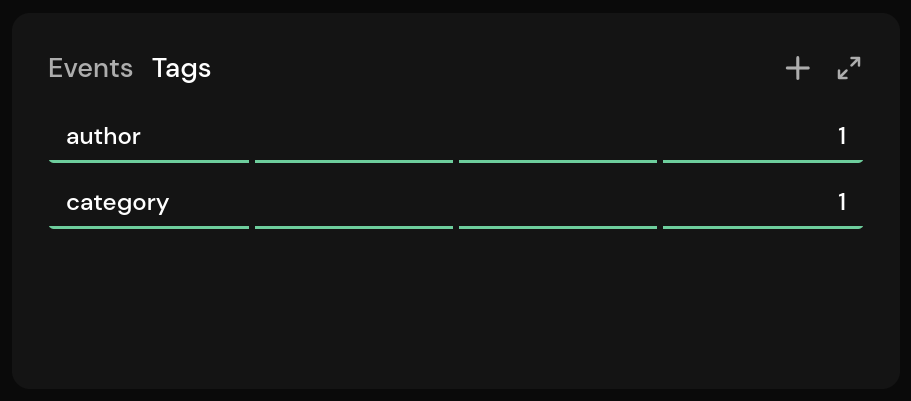
When you open the panel, you can see all the tag key-value pairs.
Example Implementation Using Tags
We have created a sample implementation on GitHub to show how tags can be used to implement A/B testing. The demo uses JavaScript, but it’s also possible to do A/B testing on the server side. The main difference would be that you would decide on the server which variant to display, and the JavaScript snippet would be constructed before sending it to the client. You could also use the API instead and avoid using JavaScript altogether. In this article, we’ll take a quick look at the JavaScript-based approach.
Let’s quickly define a hypothesis: On our page, we have a button to sign up for a course. We want to increase conversions (i.e. more people clicking the button) and are trying to figure out which headline works best in this case.
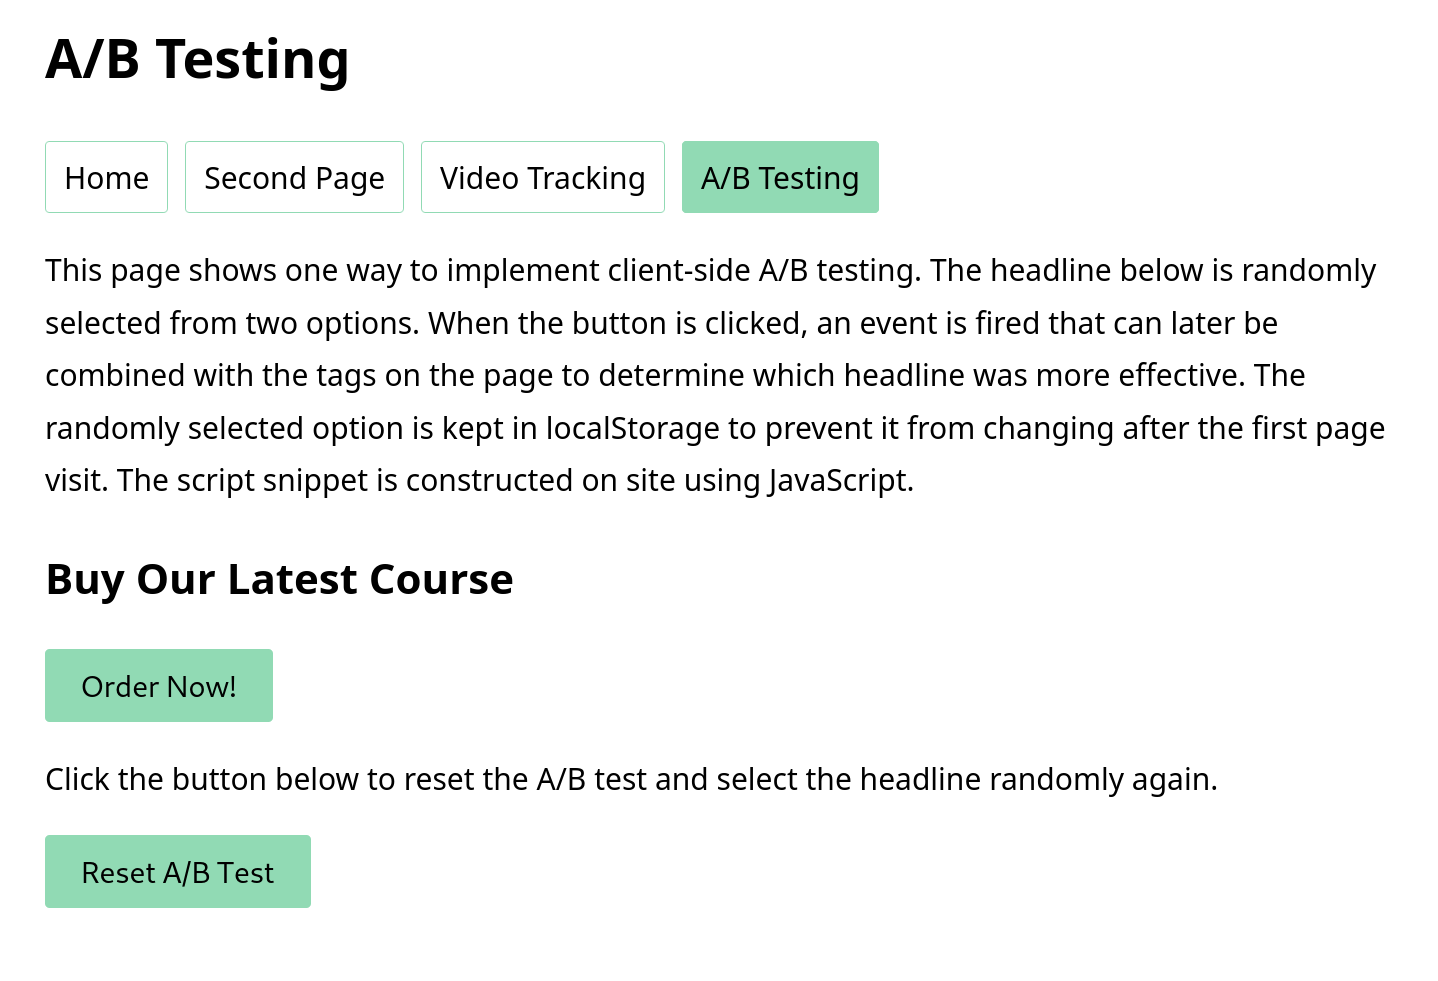
The headline above the Order Now! button is randomly selected. We have two variations for this:
- Buy our latest course
- Get access to the course
To set the headline and track the conversion, we first look at the HTML:
<h2 id="headline-experiment">Pre-filled default headline</h2>
<button pirsch-event="Order Course">Order Now!</button>
The headline has an id so we can reference it later. It’s pre-filled with a placeholder. The button has a pirsch-event attribute so that it creates a custom event when clicked. This can later be combined with the variant to see which headline converts best.
Let’s fill in the placeholder for the headline.
const variants = [
    "Buy Our Latest Course",
    "Get Access to the Course"
];

let variant = localStorage.getItem("headline-experiment");
let headline = "";

if (variant) {
    headline = variants[variant];
} else {
    variant = Math.round(Math.random() * variants.length);
    headline = variants[variant];
}

document.getElementById("headline-experiment").innerText = headline;
localStorage.setItem("headline-experiment", variant);
First, we define an array of headline variants. The list can be extended if needed, so you could compare more than two headlines in this scenario. Next, we check to see if a variant has been selected in the past. If the visitor visits the site again, we don’t want him to see a different headline every time he opens the page. The previously selected variant is stored in localStorage.
If the page hasn’t been visited yet, we randomly select an entry from the array and set it to the h2 element. The selection is then stored in localStorage for subsequent page views.
Now that we have chosen a variant, we can follow the experiment on Pirsch. The Pirsch snippet is built using JavaScript in this demo, and hasn’t been placed inside the <head> section of your page. This also means that we will not track page views until the page has fully loaded.
const snippet = document.createElement("script");
snippet.src = "https://api.pirsch.io/pirsch-extended.js";
snippet.id = "pirschextendedjs";
snippet.setAttribute("data-code", "your_identification_code");
snippet.setAttribute("data-tag-headline-experiment", headline);
document.body.appendChild(snippet);
snippet.addEventListener("load", () => pirschInit());
The script will construct the snippet and set all relevant attributes. This includes the `data-tag-headline-experiment’ which is used to track which headline was shown to the visitor.
Calling pirschInit after the script has loaded is necessary to add all relevant events to the page, including the pirsch-event button click in the HTML. Usually this happens automatically on page load if you have added the script to the <head> section of your page.
And that’s it! When the visitor visits your page, they will see one of the two headlines. Which one is attached to the page view will be automatically tracked in the dashboard. Clicking on the button will trigger the event so we can measure the conversion.
Analyzing the Results
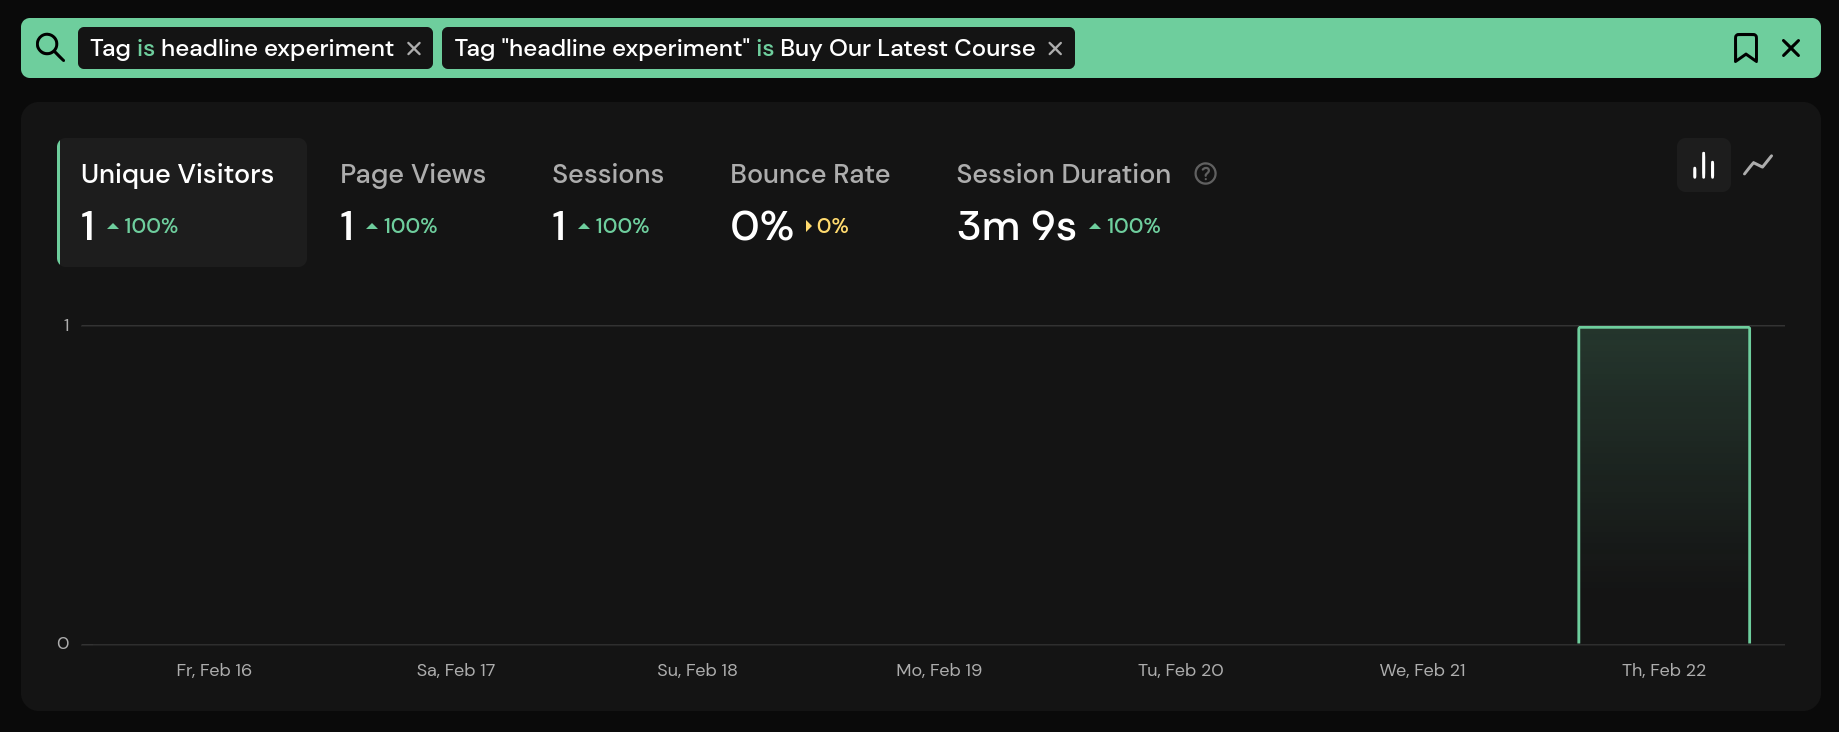
Visiting the page will now look like this on the dashboard. The button has not been clicked, so there is no event.
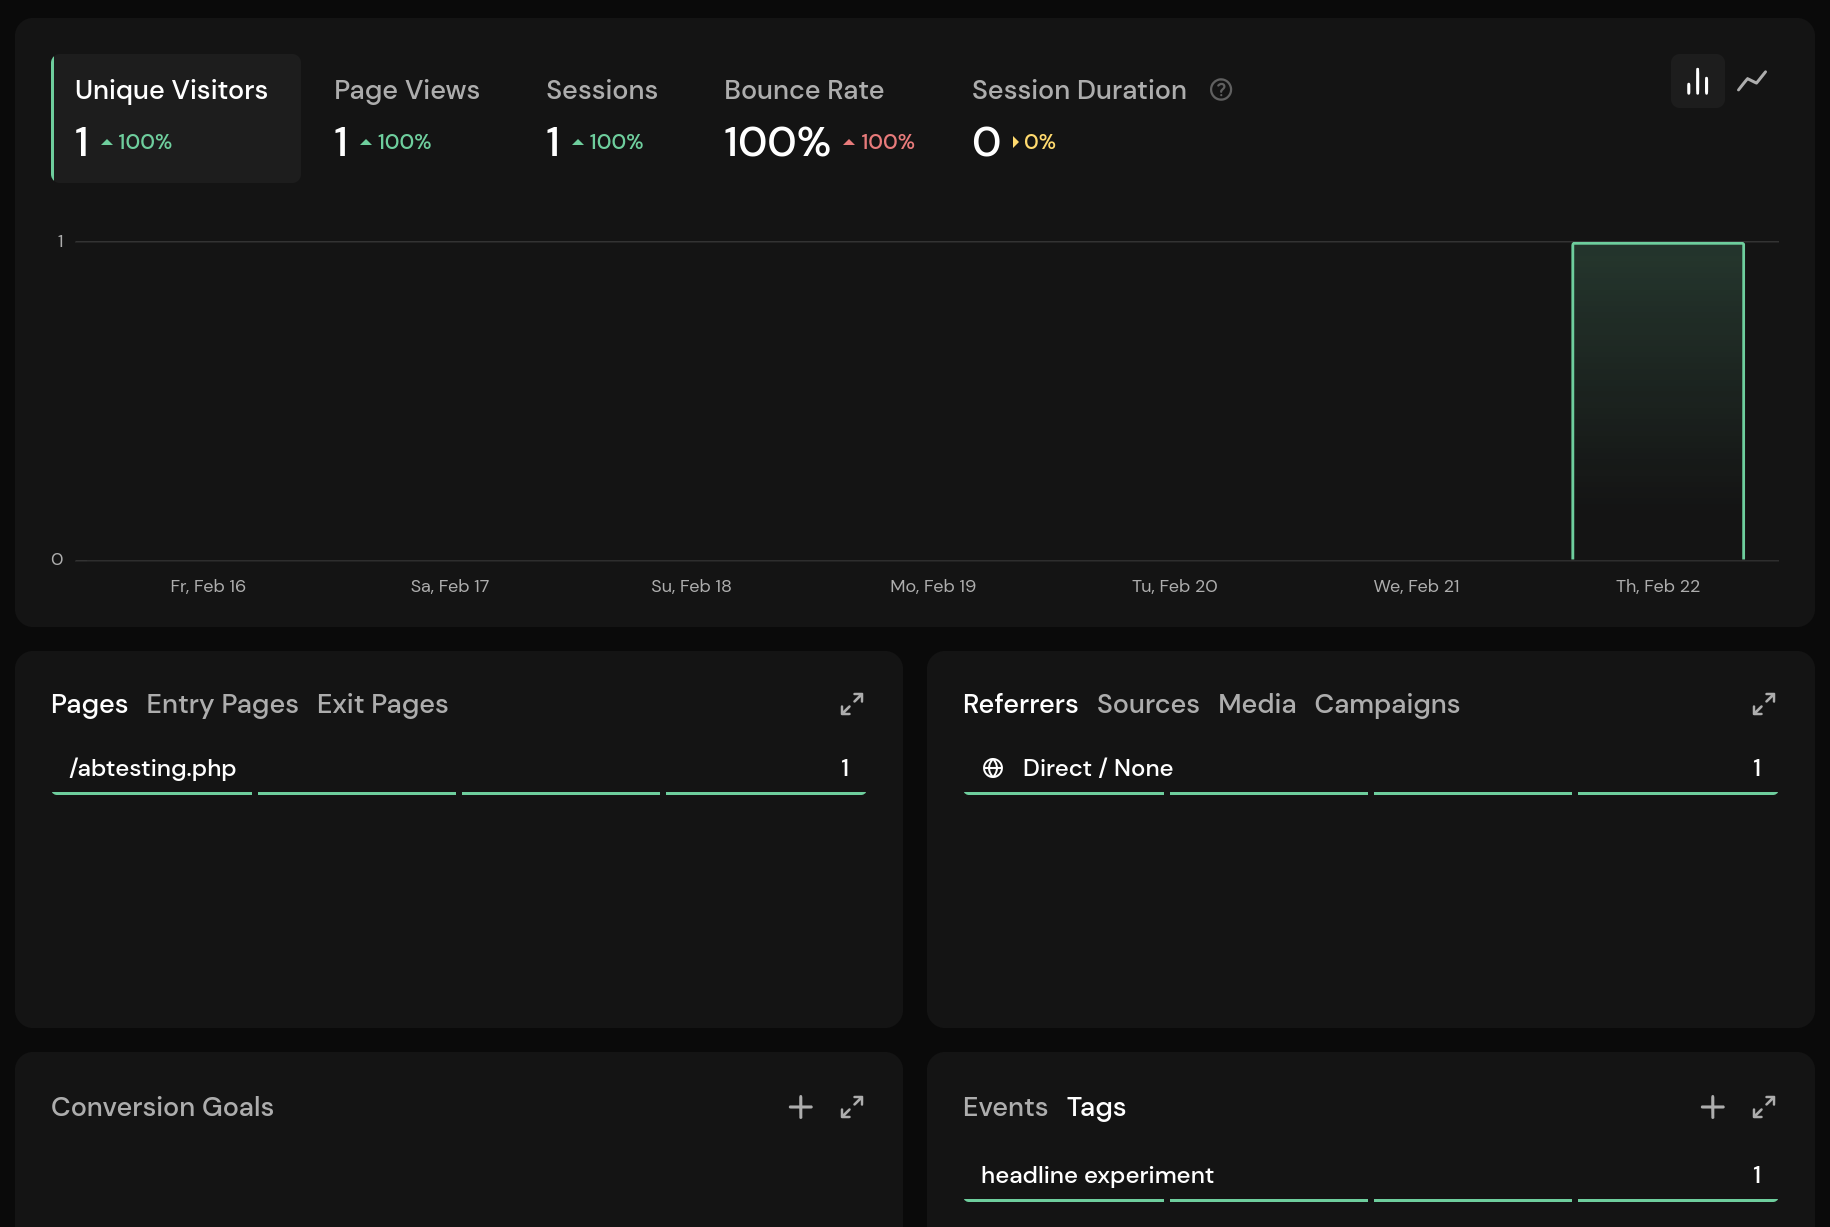
You can see that we have a visitor with the headline experiment tag attached. The value is set to Buy Our Latest Course. This could also have been set to the other headline since it is randomly selected.
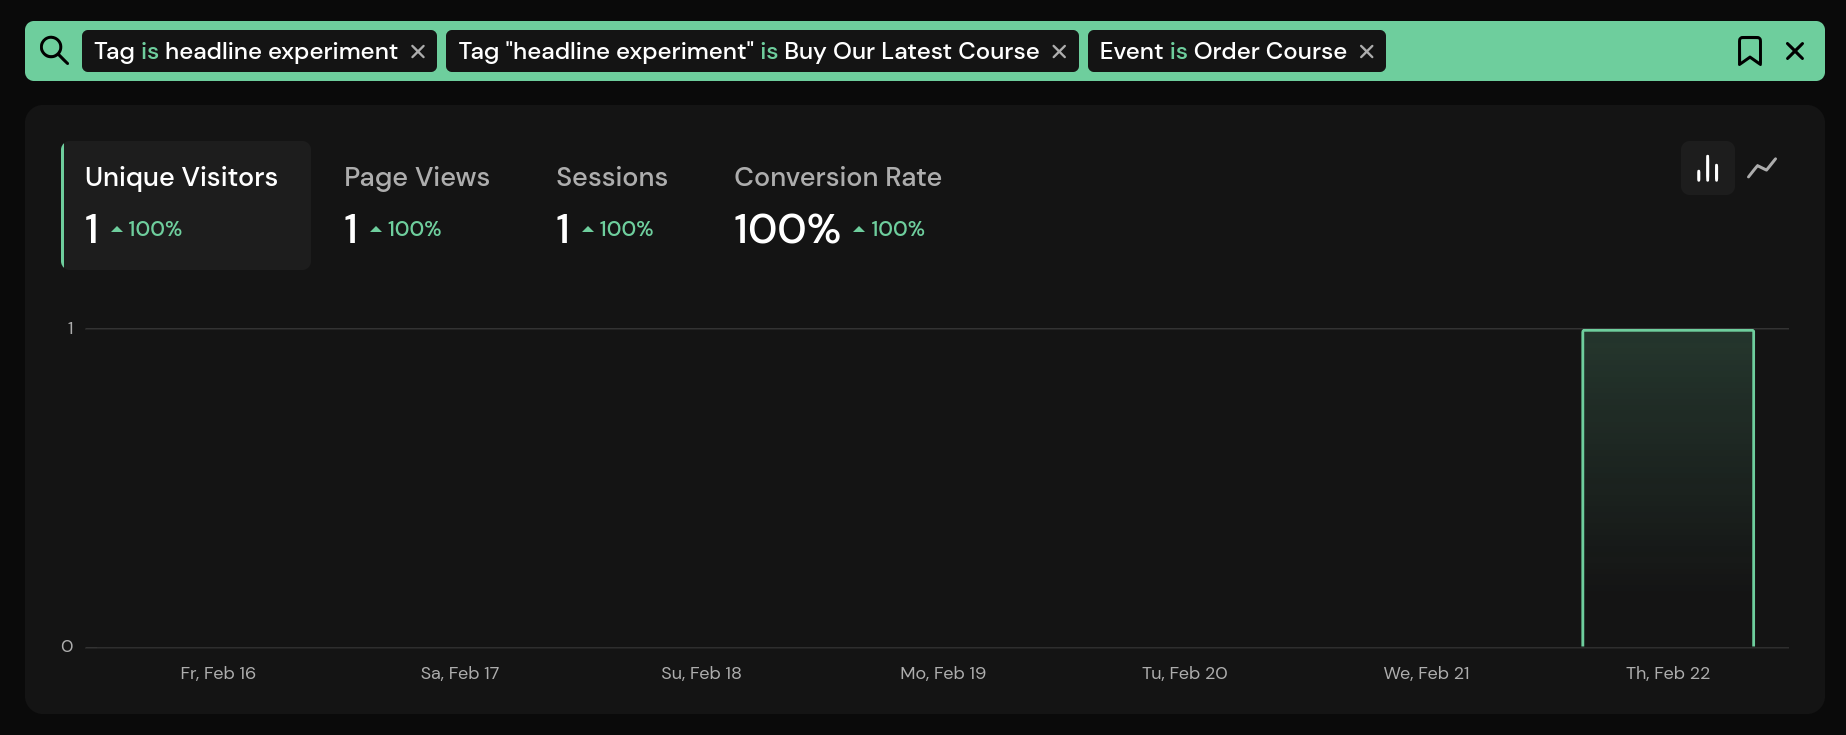
Clicking on the tag and value in the Details dialog will filter the dashboard for the A/B Experiment variant.
When the button is clicked, the conversion is tracked by the custom event. You can add it to the filter to see the results.
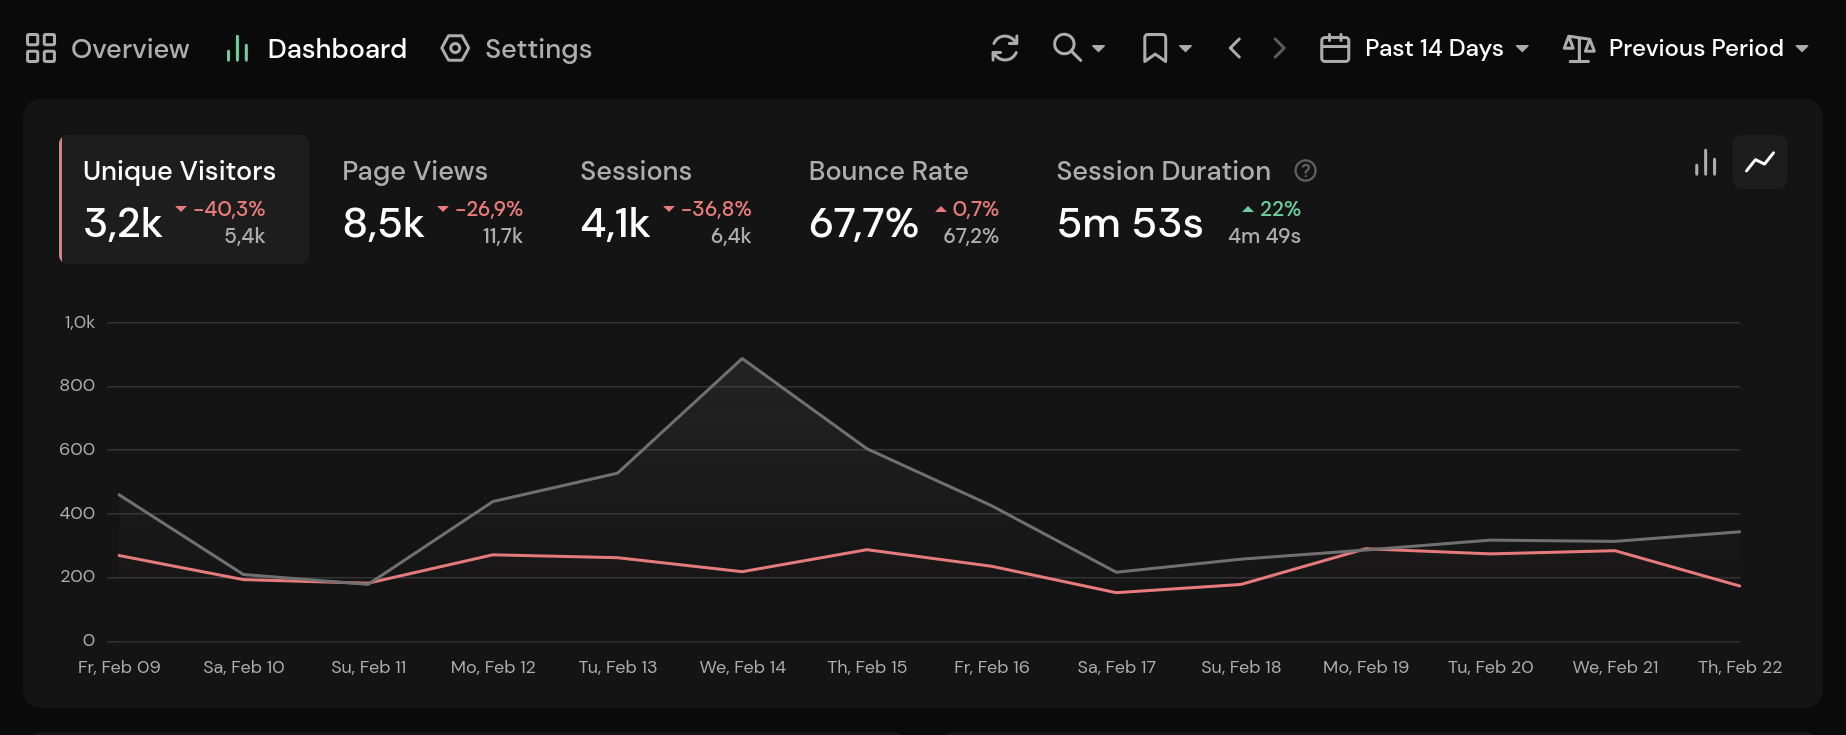
With more data, you can begin to compare the two and see which headline is more effective. The new comparison mode (since Pirsch version 2.2) is very useful in this case.
Conclusion
A/B testing is a powerful tool to increase the number of conversions on your website and to track variations. I hope you found this article useful. If you have any questions, don’t hesitate to contact us via email, Twitter, Mastodon, or on the public support forum.

