
Update: We’ve added a demo for regular HTML video elements!
We’ve talked about it and been asked about it many times, but we’ve never really shown how to track the playback time of a HTML, YouTube, or Vimeo video using Pirsch and custom events. I’m going to change that in this article.
What Will We Track and How Will It Be Useful?
Showing rather than telling what your product, service or company does in a video can be very effective. It’s more personal and saves time when the visitor can watch a short video instead of reading an entire web page. But how many people actually watch a video on your website? For how long? Do they finish it?
These questions can be answered using custom events in Pirsch. Combined with conversion goals, you can get a nice graph of how long visitors watch your videos on average. We track:
- When a visitor has started playback
- The percentage of time a video has been watched
- When a visitor has finished watching a video
- A graph of the average play time (also in percent)
First, I’ll show you how to use the, HTML, YouTube, and Vimeo APIs to query playback time. Then I will show you what the results look like on the dashboard and how to set up conversion goals. The full source code can be found as part of our demo repository on GitHub.
Setting up Video Tracking for the HTML Video Elements
First, we need some data. To track the playback time of a video, we’ll send a custom event with three metrics: the playback time in percent, whether the video has started, and whether it has finished.
For tracking, you should embed the Pirsch snippet (pa.js) in the head section of your website. This will automatically track a page view and provide the pirsch event function.
<script defer src="https://api.pirsch.io/pa.js"
    id="pianjs"
    data-code="YOUR_IDENTIFICATION_CODE"></script>
Next, we add the video element to the page.
<video id="video" width="640" height="360" controls>
    <source src="/video/video.mp4" type="video/mp4" />
    <source src="/video/video.ogg" type="video/ogg" />
    Your browser does not support the video tag.
</video>
This will load the video.mp4 or video.ogg, depending on the visitors browser. Note that we added the id attribute, so that we can access the video element from JavaScript.
Let’s add the JavaScript skeleton, which we will fill out step by step.
<script>
    (function() {
        document.addEventListener("DOMContentLoaded", () => {
            const player = document.getElementById("video");
            let progress = 0;
            let started = 0;
            let completed = 0;

            player.addEventListener("playing", () => {

            });

            player.addEventListener("pause", () => {

            });

            player.addEventListener("ended", () => {

            });

            window.addEventListener("beforeunload", () => {

            });
        });
    })();
</script>
The snippet above will wait for the page to be fully loaded (document.addEventListener("DOMContentLoaded", () => {).
We then select the video player on the site using the id we set earlier and initialize three variables for the metrics we would like to track. The relative progress (0% to 100%), and if the video has started and completed.
Next, we add three event listeners. Three of them to the player to handle playback events, and one to window to send the Pirsch custom event when the page is unloaded (left or closed).
Let’s fill out the handlers. playing and ended are really simple. They will be fired when the video is played and if it has ended (watched fully through). In case it has ended, we can also set the progress to 100%.
player.addEventListener("playing", () => {
    started = 1;
});

player.addEventListener("ended", () => {
    progress = 100;
    completed = 1;
});
On pause, we need to calculate the progress. This will use two fields, the currentTime and the duration. The currentTime field is set to the current playback time, like 3.12 seconds. The duration is the total duration of the video, also in seconds.
player.addEventListener("pause", () => {
    const p = Math.round(player.currentTime / player.duration * 100);

    if (p > progress) {
        progress = p;
    }
});
As you can see, multiplying the progress by 100 and rounding the number will give us a nice number between 0 and 100. We only update the progress when it has further progressed than it did before, in case the visitor seeks the video.
The last step is to send the event to Pirsch.
window.addEventListener("beforeunload", () => {
    if (started) {
        pirsch("Video Playback", {
            meta: {
                progress,
                started,
                completed
            }
        });
    }
});
The event is only tracked if the video has been started.
Setting Up Video Tracking for YouTube
To track YouTube videos, we need to add the YouTube API script. This is used to set up the player and attach events to it so we can track its progress. Add it to the head section of your page.
<script src="https://www.youtube.com/iframe_api"></script>
Alright, now that we have these in place, we can start embedding the video into your website. Normally, you would just add an iframe to your site that looks something like this.
<iframe width="560"
    height="315"
    src="https://www.youtube.com/embed/dQw4w9WgXcQ?si=EEO27bqXDcymifbj"
    title="YouTube video player"
    frameborder="0"
    allow="accelerometer; autoplay; clipboard-write; encrypted-media; gyroscope; picture-in-picture; web-share"
    allowfullscreen></iframe>
In our case, we need to set it up through JavaScript so that we can attach the necessary events. Replace the iframe on your page with a simple div.
<div id="youtube"></div>
The id can be anything, but you need to set it in the code below. Now add a <script> tag right after that. We’ll use this to set up the player.
<script>
    (function() {
        let player;
        let progress = 0;
        let started = 0;
        let completed = 0;

        function onYouTubeIframeAPIReady() {
            // ...
        }

        window.addEventListener("beforeunload", () => {
            // ...
        });
    }());
</script>
The player variable will hold the player instance. The progress, started, and completed variables are used for tracking.
The onYouTubeIframeAPIReady will be triggered by the YouTube iframe API script we’ve embedded in the head section. It must match this name exactly. If you have multiple players on your site, you will need to set them all up in this single function.
The beforeunload event listener is triggered when the tab or window is closed or the page is navigated away. We’ll use it to send the data to Pirsch.
Let’s start by setting up the player. Add the following code to your onYouTubeIframeAPIReady function.
player = new YT.Player("youtube", {
    height: "360",
    width: "640",
    videoId: "dQw4w9WgXcQ",
    events: {
        "onStateChange": (event) => {
            if (event.data === YT.PlayerState.PLAYING) {
                started = 1;
            } else if (event.data === YT.PlayerState.PAUSED) {
                const p = Math.round(player.getCurrentTime() / player.getDuration() * 100);

                if (p > progress) {
                    progress = p;
                }
            } else if (event.data === YT.PlayerState.ENDED) {
                progress = 100;
                completed = 1;
            }
        }
    }
});
As you can see, the video ID iThe event is only tracked if the video has been started.s the same as in the regular iframe (dQw4w9WgXcQ). The size can be adjusted as needed. Important for tracking is the events section.
We have added a listener for state changes. In our case we only care about the PLAYING, PAUSED and ENDED events. When the video starts, we set started to 1. When the video is finished, we set the progress to 100 (percent) and completed to 1. They are tracked as 0 and 1 so that we can calculate graphs from them.
Progress is tracked by dividing the current playtime by the duration of the video. We round this number to ensure that it can be grouped properly on the dashboard later. Otherwise we would have unique playtimes for basically every visitor, like 56.92842 instead of 56.
That’s all there is to it. Now we just need to send an event to Pirsch when the page is navigated away or the window or tab is closed. Add the following code to the beforeunload event listener.
if (started) {
    pirsch("YouTube Playback", {
        meta: {
            progress,
            started,
            completed
        }
    });
}
The event is only tracked if the video has been started.
Setting Up Video Tracking for Vimeo
The setup for vimeo is very similar to YouTube. For simplicity, I’ll just show the differences here.
Instead of adding the YouTube iframe API script, add the Vimeo script to the head section.
<script src="https://player.vimeo.com/api/player.js"></script>
It also requires a div on the page, which is later replaced by the player.
<div id="vimeo"></div>
To initialize the player, replace the onYouTubeIframeAPIReady with the following code.
document.addEventListener("DOMContentLoaded", () => {
    const iframe = document.querySelector("#vimeo");
    player = new Vimeo.Player(iframe, {
        id: 76979871, // video ID
        width: 640
    });

    player.on("timeupdate", data => {
        const p = Math.round(data.percent * 100);

        if (p > progress) {
            progress = p;

            if (p >= 100) {
                progress = 100;
                completed = 1;
            }
        }
    });

    player.on("play", () => {
        started = 1;
    });
});
The logic is almost identical to that for YouTube, but instead of attaching an ended event, we simply set it to completed when the video progress reaches 100%. The Pirsch event trigger also stays the same, but you may want to change the event name.
Analyzing Video Statistics
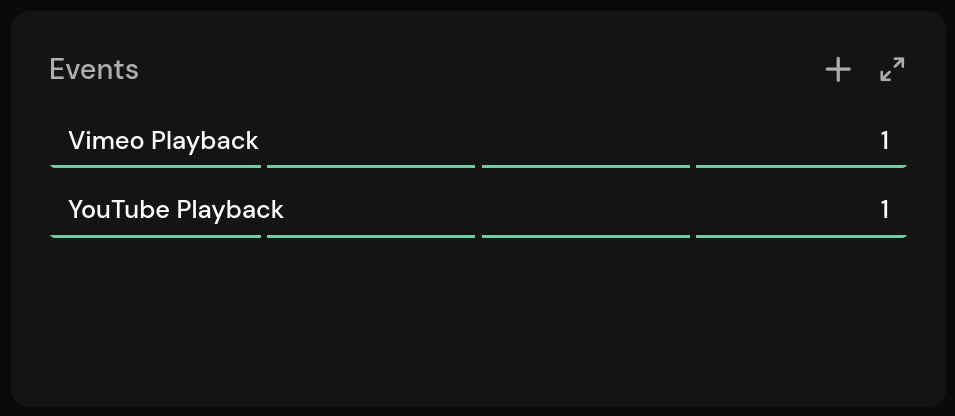
Now that we have collected the progress as custom events, we can take a look at the dashboard. For the demo, there is a YouTube video and a Vimeo video on the page. Both will appear in the events panel.
If you open the details view (top right corner of the panel), you can see the metadata attached to each event.
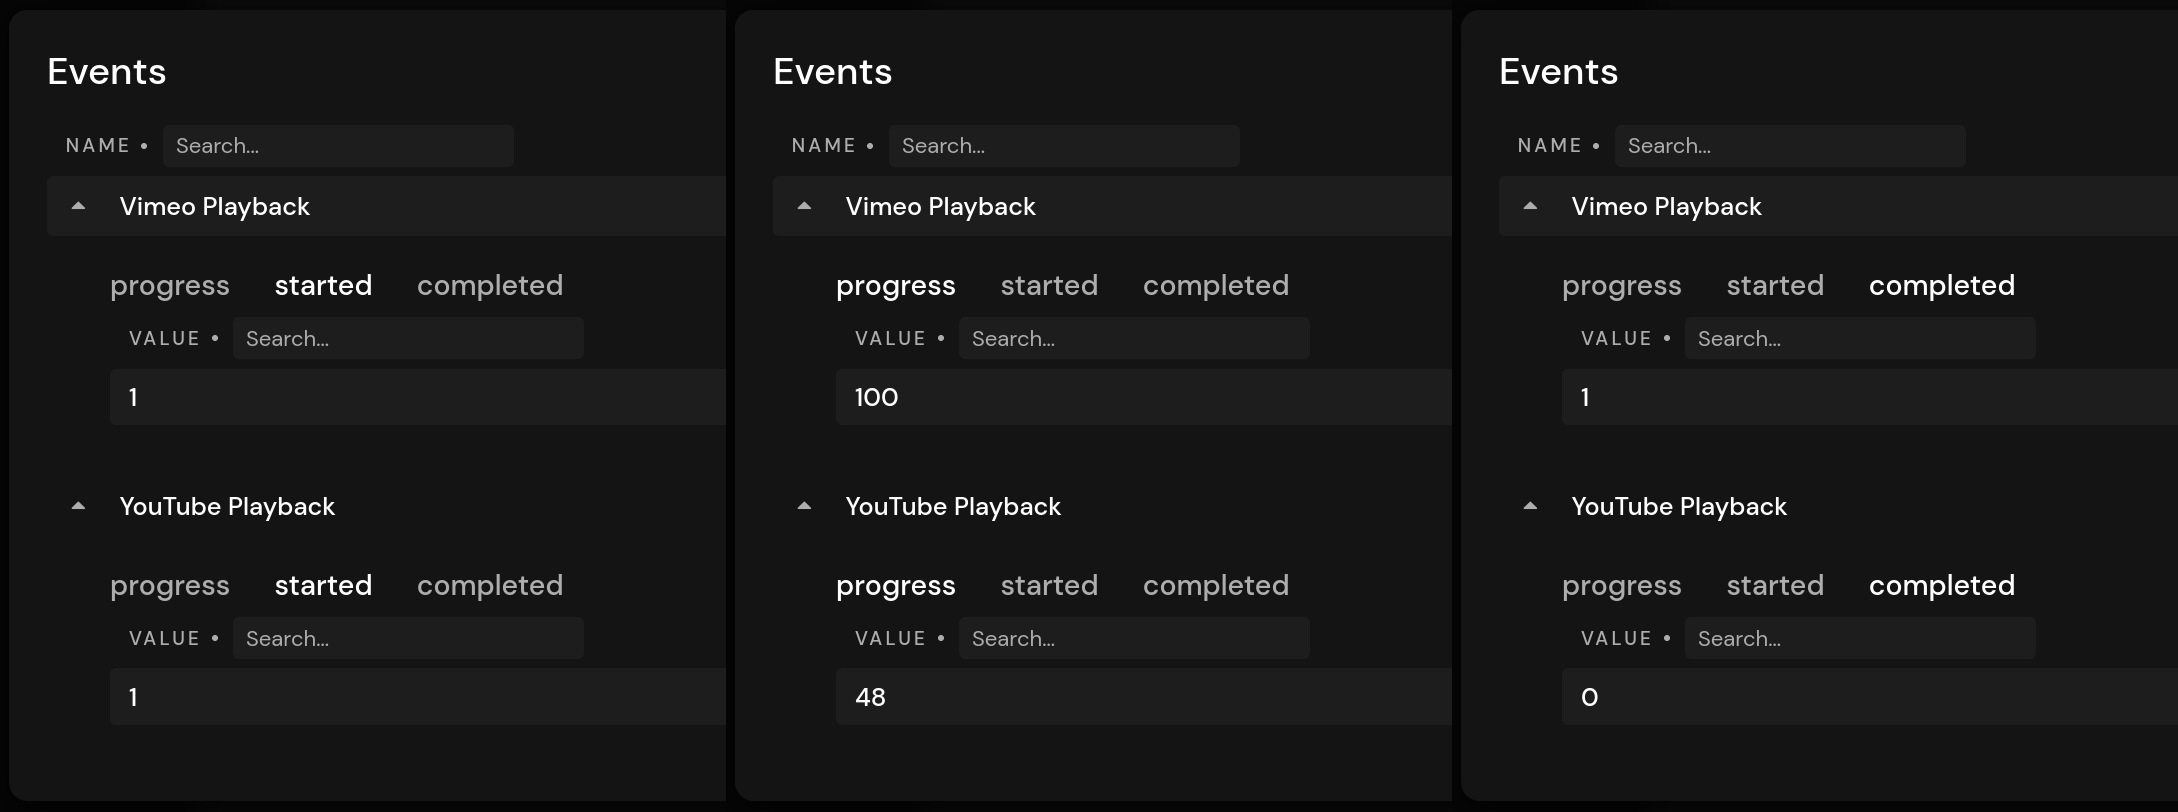
The metadata statistics tell you how many times a video has been watched and for how long. The progress is grouped in one percent increments. If you prefer larger steps, you can change the calculation in the JavaScript snippets.
started is always set to one in the demo because we don’t collect events if the video hasn’t been started. Of course, you could change this to see how many visitors didn’t watch the video. The alternative would be to filter for the event and metadata and exclude them from the results.
To see a graph of the number of people who have watched a video over time, click on the progress metadata entry you want to see.
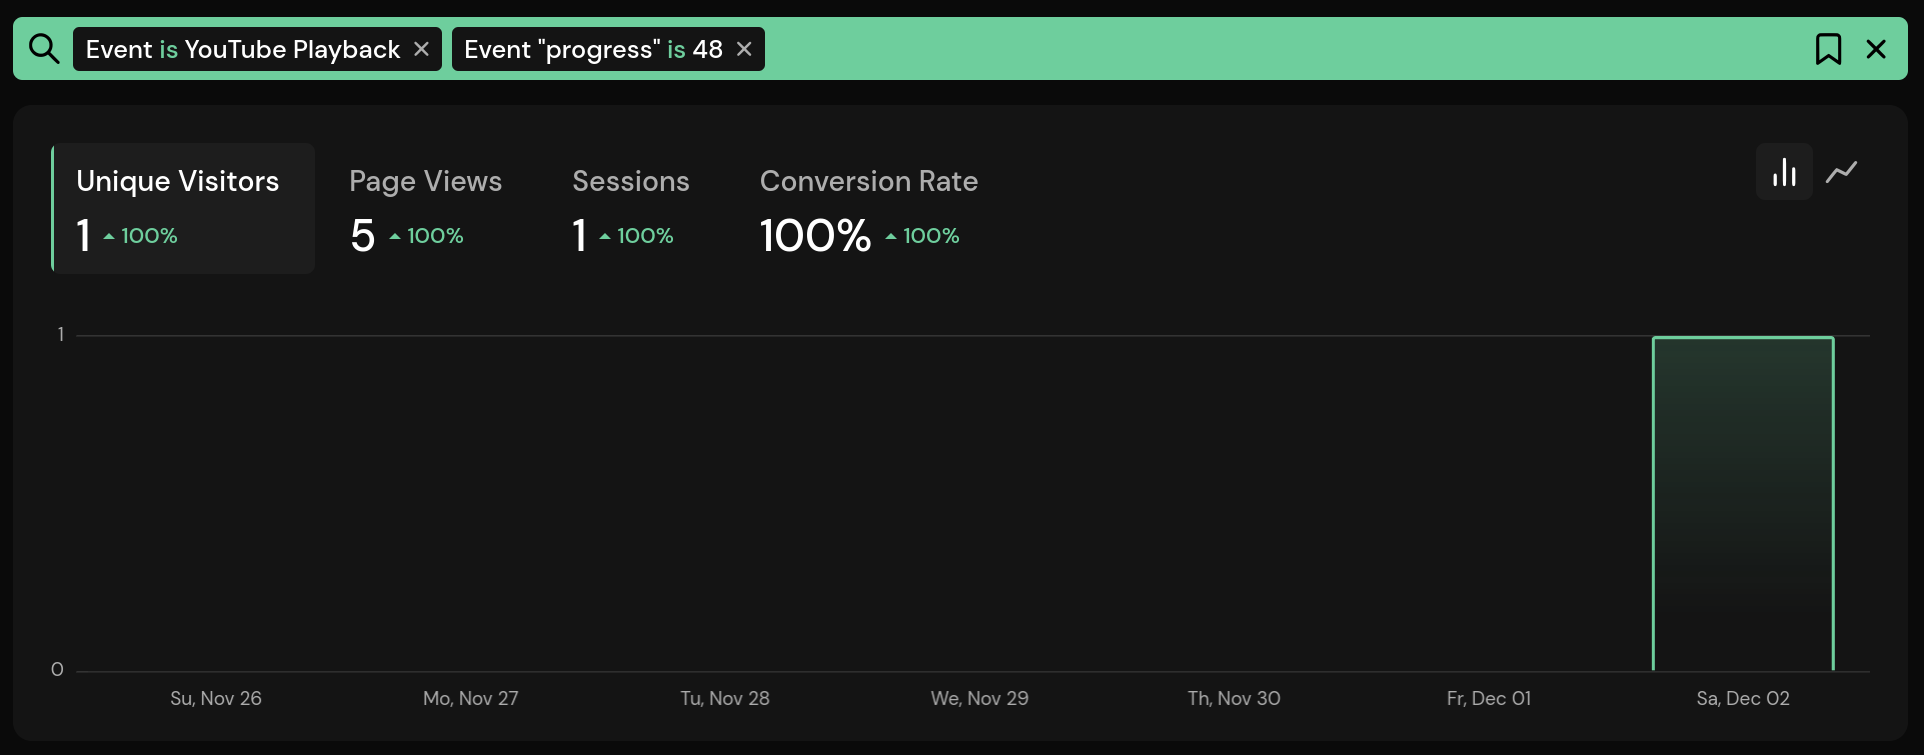
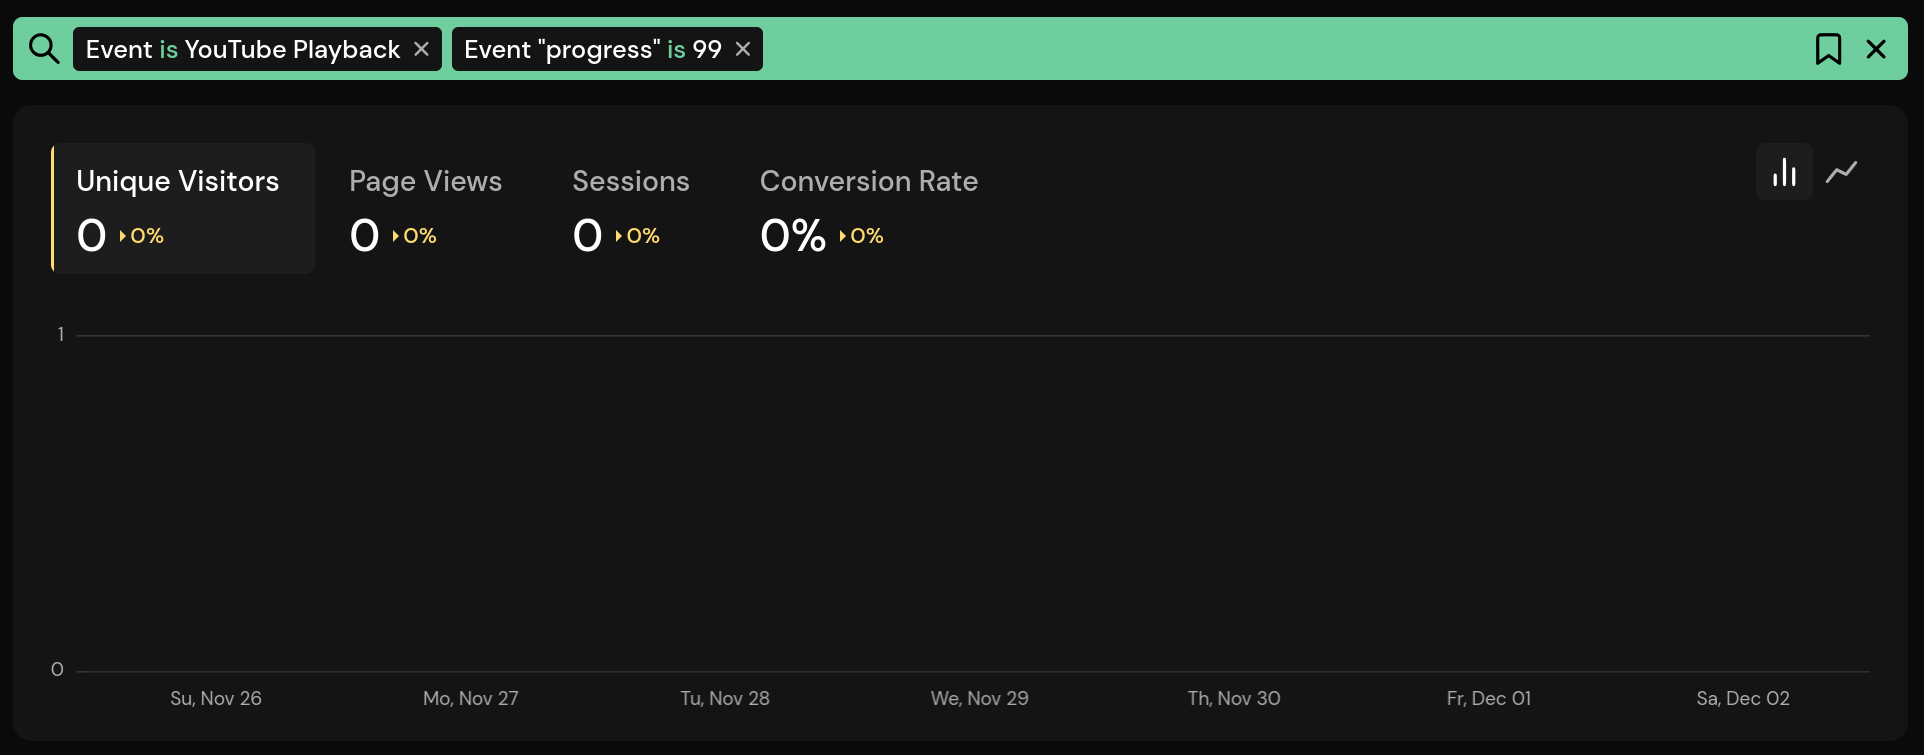
This will show all visitors who watched 48% of the video. You can adjust the number directly in the filter. For example, setting it to 99% won’t show any results.
Setting up a Conversion Goal
To get a better understanding of the progress of the playback, you can create a conversion goal. Here is an example.
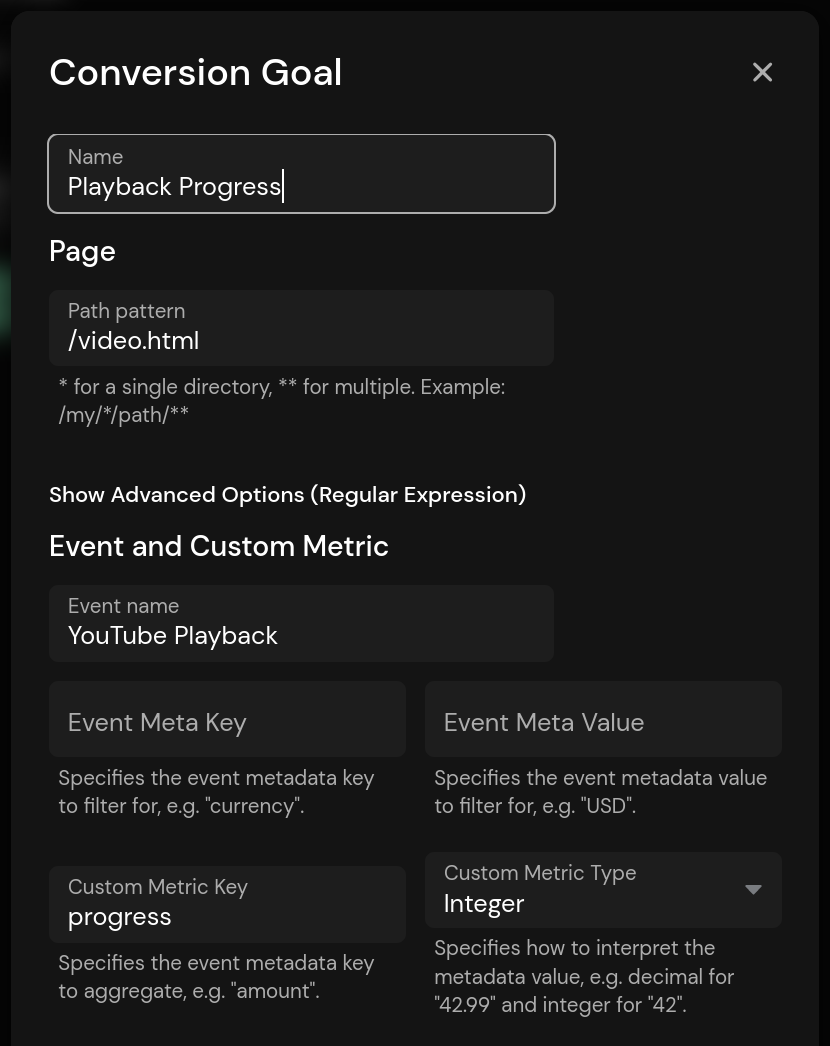
In this case, it’s called Playback Progress and only applies to the /video.html page. The conversion goal will filter for the YouTube Playback event and create a graph from the progress metadata field, which we interpret as integers.
Clicking on the conversion goal in the dashboard will display the following graph.
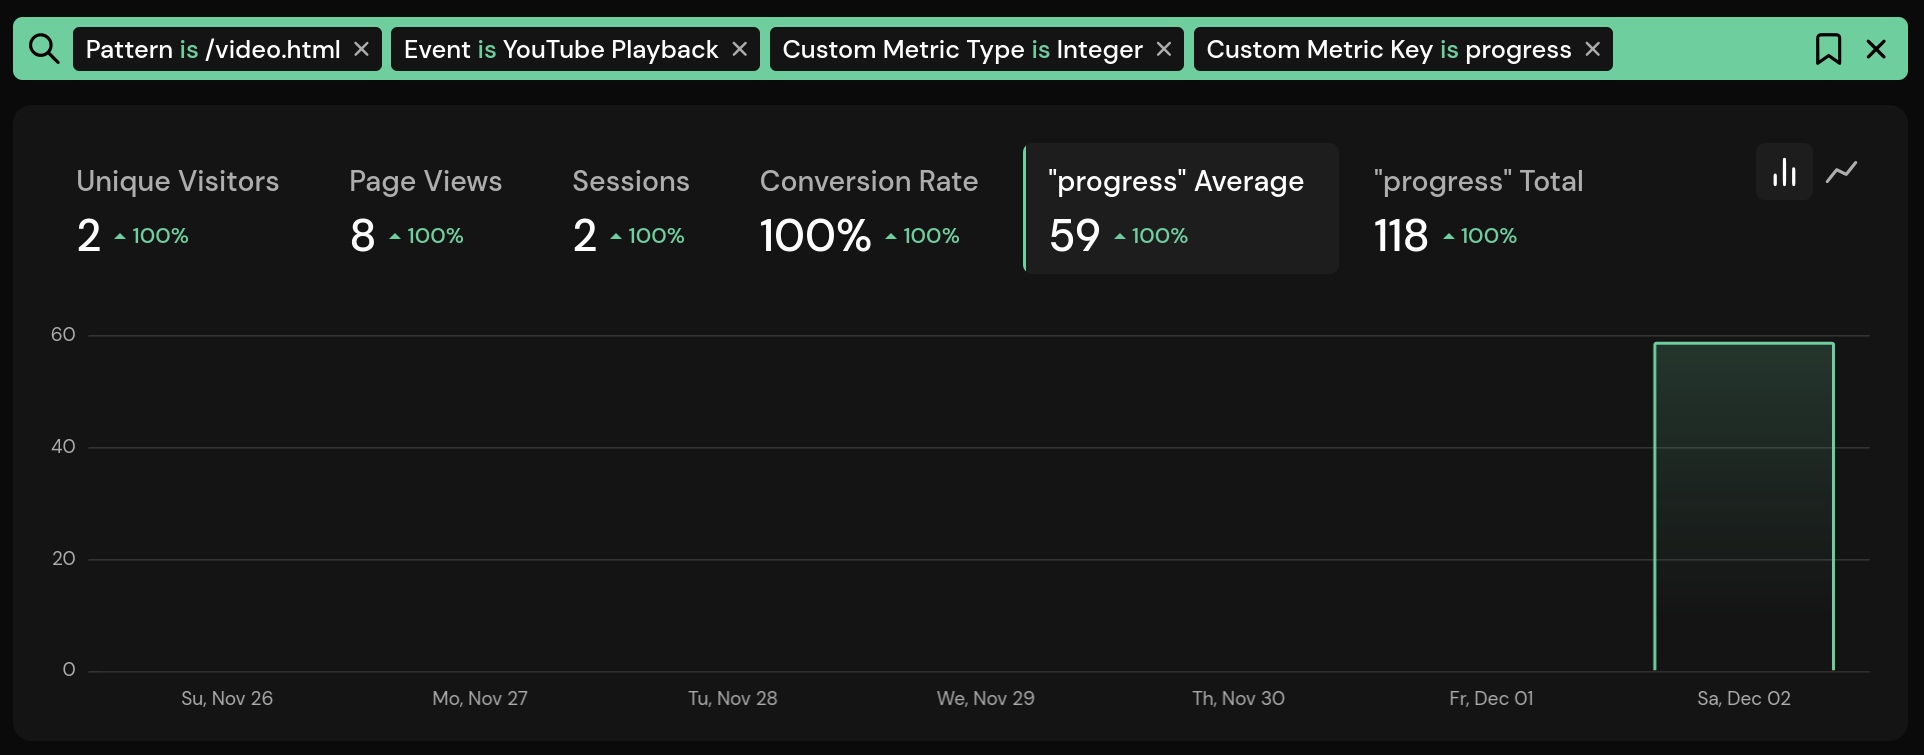
In this case, the average progress was 58% for two visitors. You can add additional conversion goals for the started and completed fields. Since we set them to 0 or 1, they can again be interpreted as integers.
Conclusion
I hope you enjoyed reading this little tutorial. Again, the full source code for the demo can be found on GitHub. Please reach out if you have any questions.

